Calibration score
Overview
A calibration score test enables you to assess how well the scores generated by a classification model align with the model's probabilities. In other words, the validation test can estimate how good the generated probabilities can be for a test dataset with real-world examples. In the case of a multi-class model, the validation test repeats the test for each target class.
H2O Model Validation utilizes the Brier score to assess the model calibration of each target class. The Brier score ranges from 0 to 1, where 0 indicates a perfect calibration. After the test, H2O Model Validation assigns a Brier score to the target class (or all target classes in the case of a multi-class model).
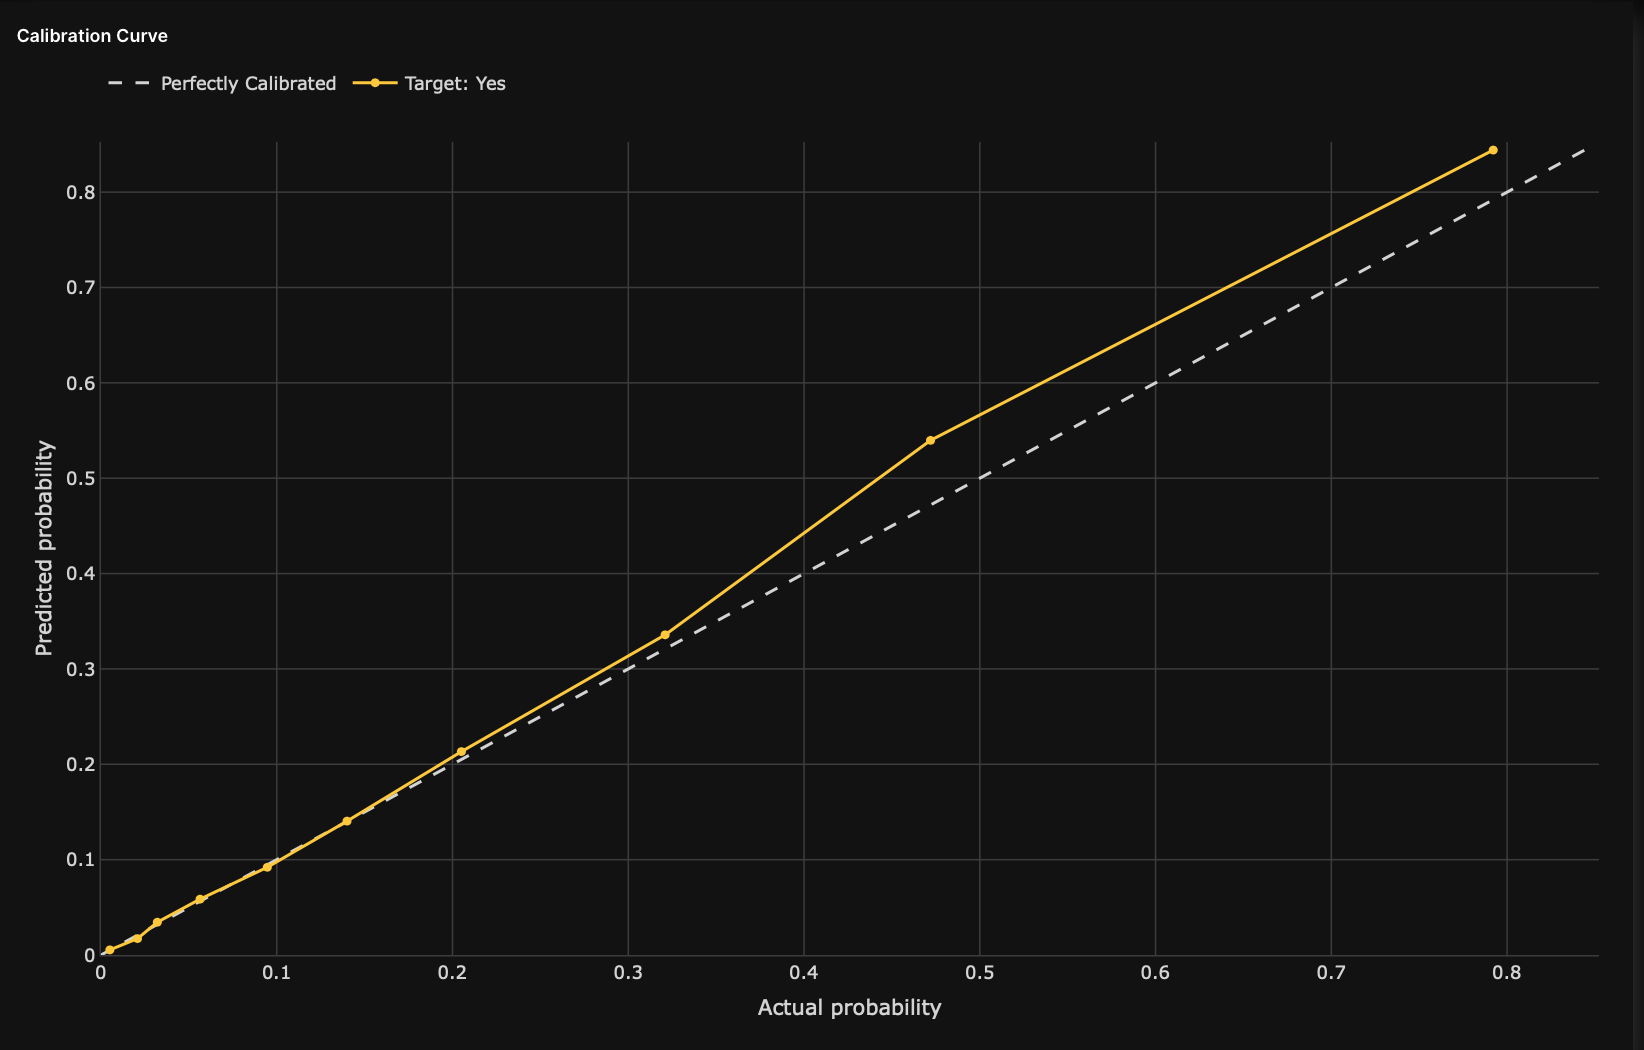
In addition, the test generates a calibration score graph that visualizes the calibration curves to identify the ranges, directions, and magnitudes of probabilities that are off. H2O Model Validation adds a perfect calibration line (a diagonal line) for reference in this calibration score graph.
H2O Model Validation provides several settings for the calibration score test.
Estimating how well the model is calibrated to real-world data is crucial when a classification model is used not only for complex decisions but supplies the probabilities for downstream tasks, such as pricing decisions or propensity to churn estimations.
Resources
- To learn how to create a calibration score test, see Create a calibration score test.
- See Settings: Calibration score to learn about all the settings for a calibration score test.
- See Metrics: Calibration score to learn about all the metrics for a calibration score test.
- Submit and view feedback for this page
- Send feedback about H2O Model Validation to cloud-feedback@h2o.ai