Metrics: Drift detection
Overview
H2O Model Validation offers an array of metrics to understand a drift detection test. Below, each metric is described in turn.
Metrics
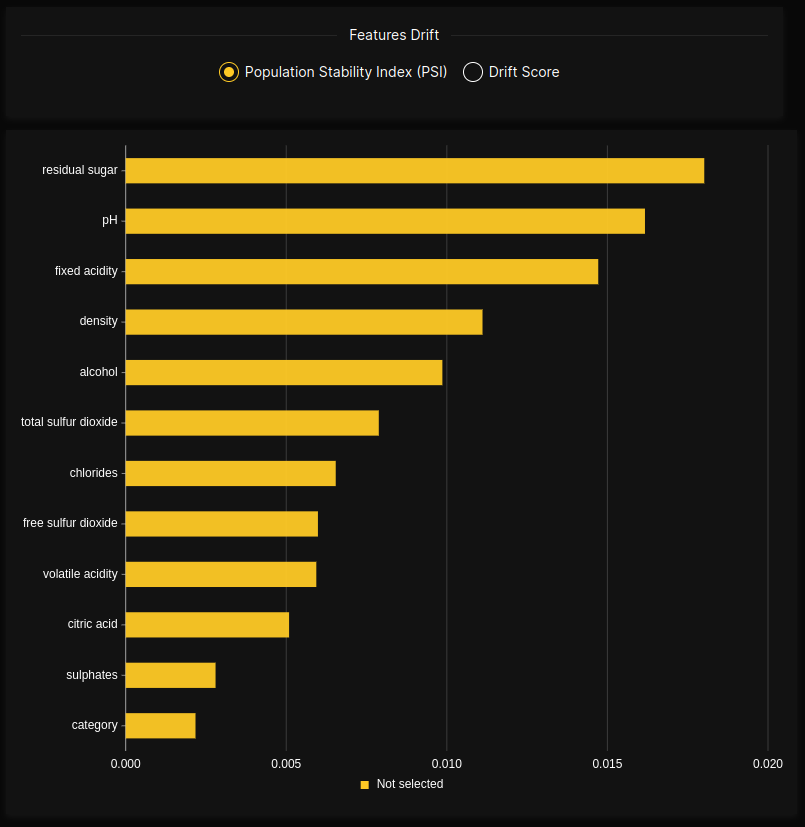
Features drift
The feature drift chart displays all of a model's variables from top to bottom, where H2O Model Validation orders variables from highest to lowest population stability index (PSI) or drift score values.
- X-axis: PSI scores or drift scores
- Y-axis: Dataset variables (features)
note
- The features drift chart displays the top 25 features.
- Clicking on a feature bar triggers the display of the following graph: Distribution of variable.
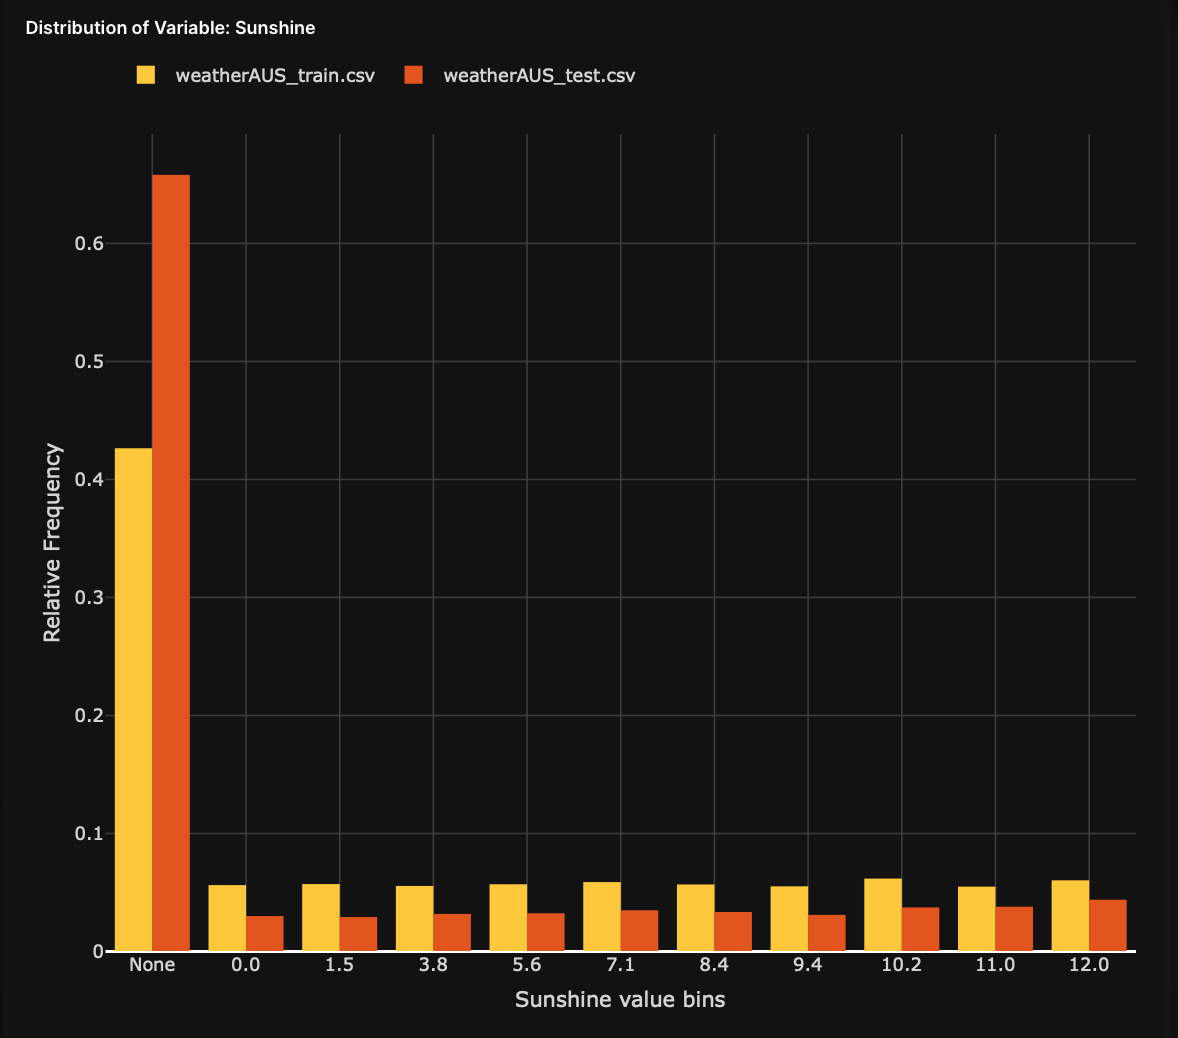
Distribution of variable
The distribution of variable histogram displays the distribution values for the selected variable in the Features drift chart. The histogram combines two histograms that H2O Model Validation has combined to highlight different and similar value distributions for the selected variable in the primary and secondary dataset.
- X-axis: A dataset's variable (feature) values
- Y-axis: Relative frequency values
Feedback
- Submit and view feedback for this page
- Send feedback about H2O Model Validation to cloud-feedback@h2o.ai