Metrics: Segment performance
Overview
H2O Model Validation offers an array of metrics to understand a segment performance test. Below, each metric is described in turn.
Settings
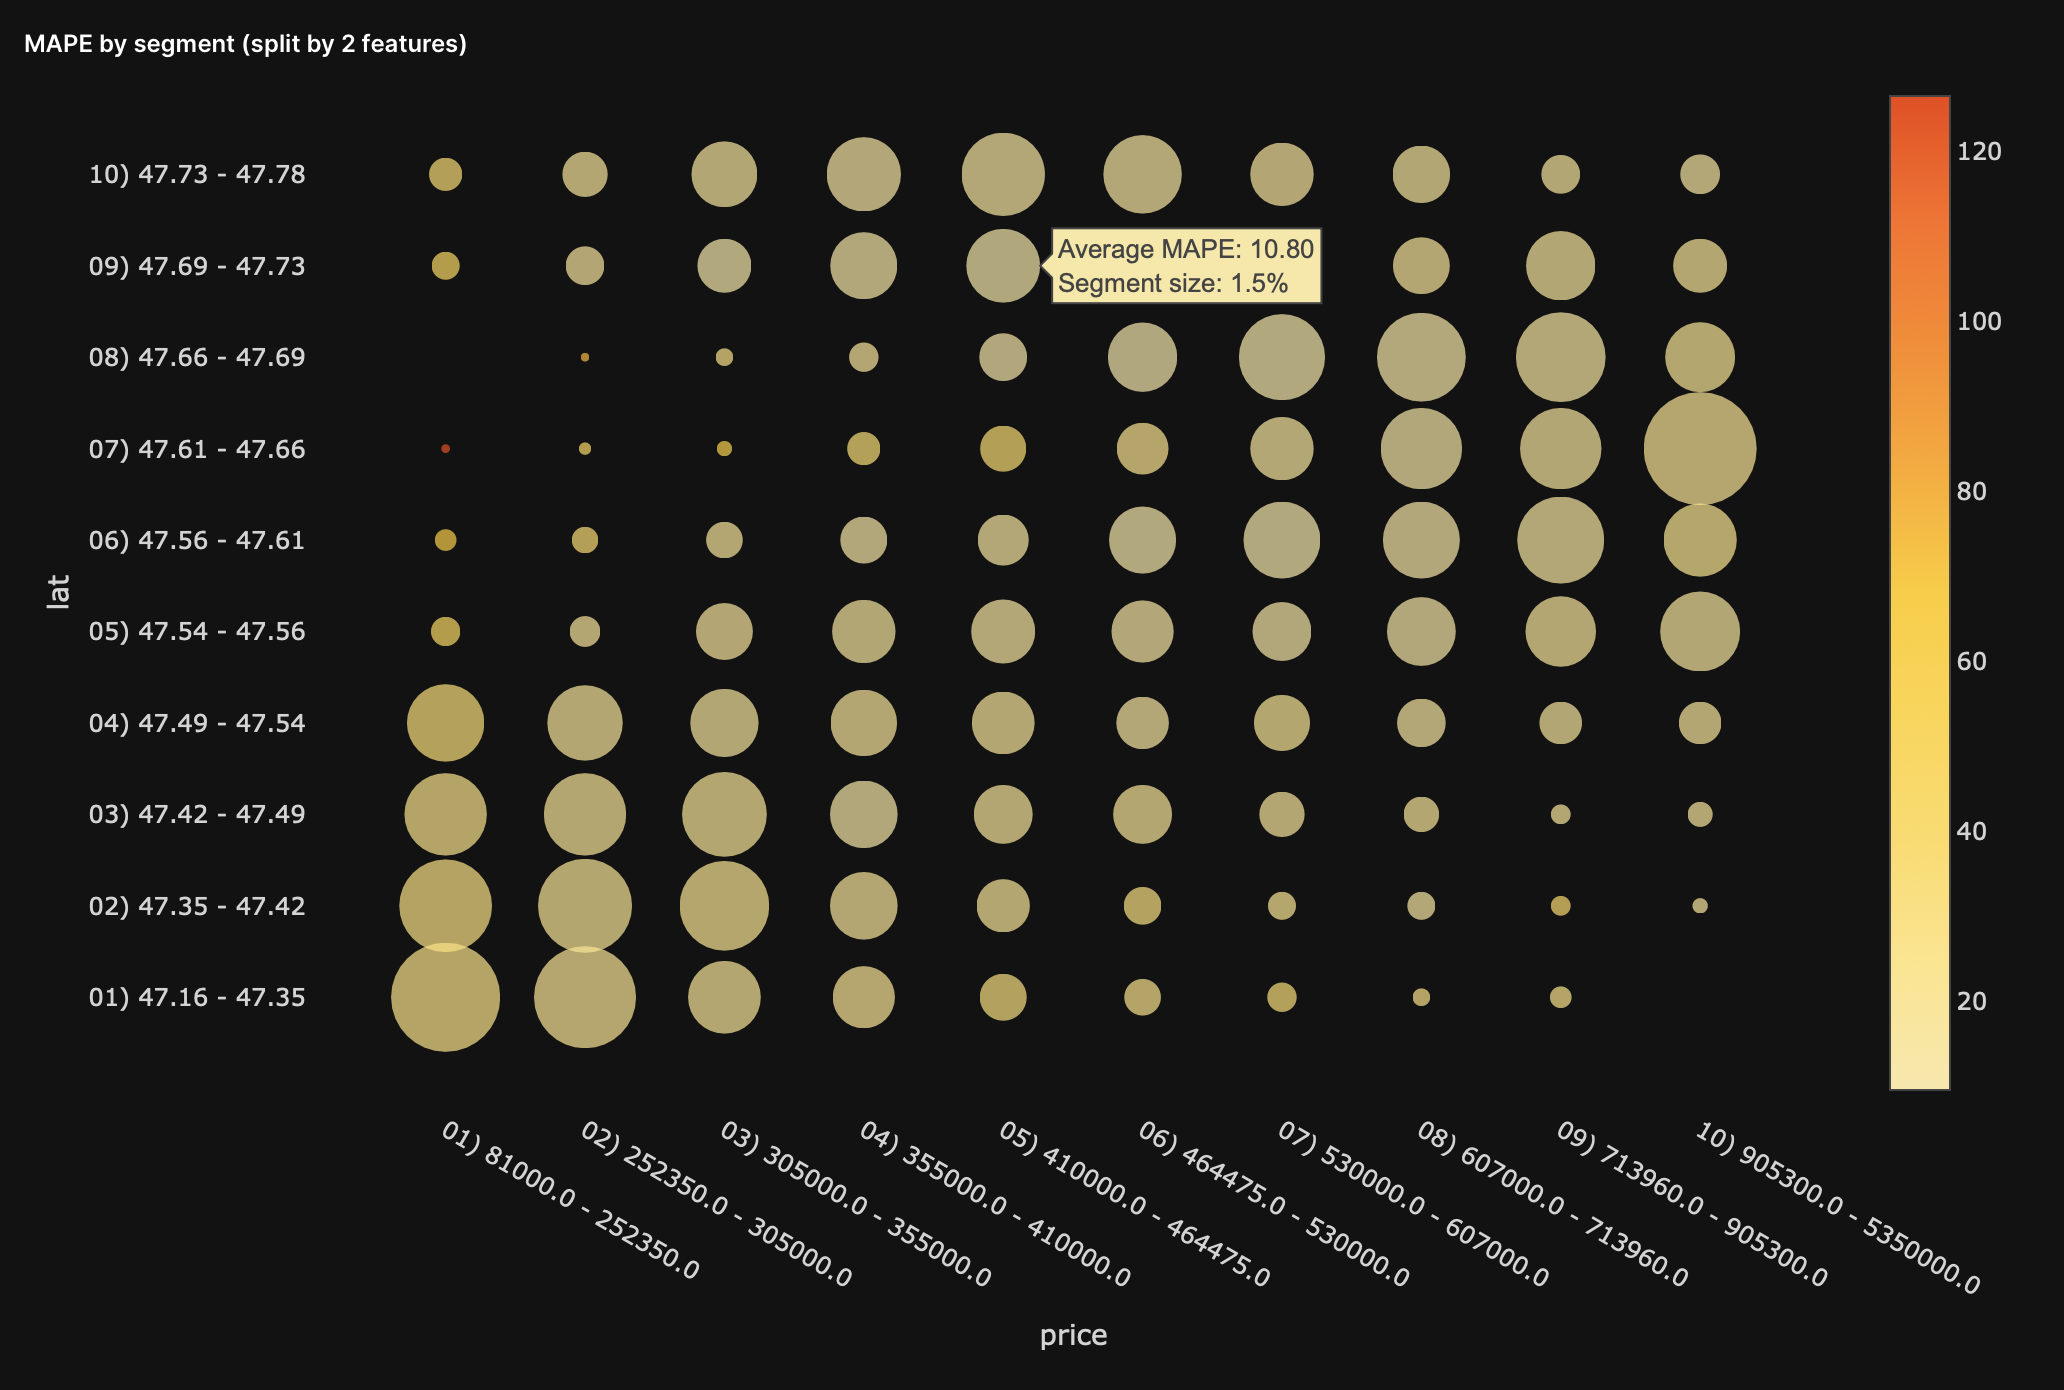
{Metric} by segment (split by 2 features)
The {metric} performance by segment (spli by 2 features) bubble graph displays the data segments of 1 or 2 defined variables. {Metric} refers to the model's scorer.
- X-axis: A variable's value bins
- Y-axis: A variable's value bins
- Bubble size: Size of the data segment
- Bubble color: The estimated model error using the metric selected in the test settings
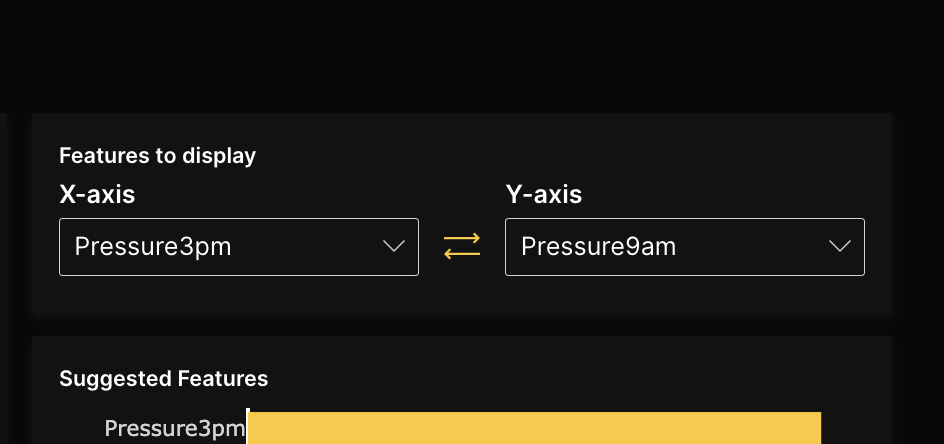
Features to display
In the features to display card, you can define the X and Y-axis for the following graph: {Metric} by segment (split by 2 features).
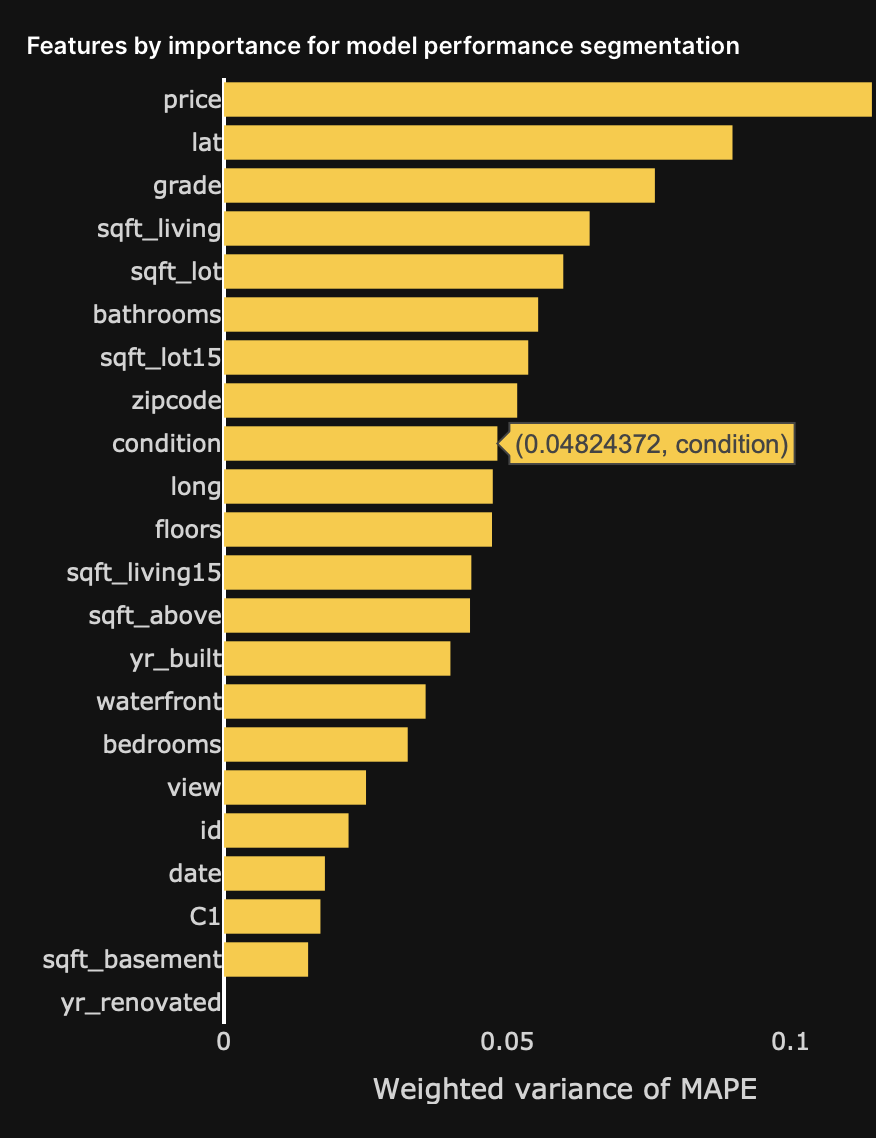
Features by importance for model performance segmentation
The feature by importance for model performance segmentation chart displays the rankings of the model variables in terms of their value for the segment performance analysis.
Feedback
- Submit and view feedback for this page
- Send feedback about H2O Model Validation to cloud-feedback@h2o.ai