Project Workspace
Driverless AI provides a Project Workspace for managing datasets and experiments related to a specific business problem or use case. Whether you are trying to detect fraud or predict user retention, datasets and experiments can be stored and saved in the individual projects. A Leaderboard on the Projects page lets you easily compare performance and results and identify the best solution for your problem.
The following sections describe how to create and manage projects.
Note:
For information on remote storage and importing datasets and experiments through the Projects page, see H2O Storage (remote storage) integration.
For information on H2O AI Cloud workspace integration where projects are backed by H2O AI Cloud workspaces, see H2O AI Cloud (HAIC) workspace integration.
For information on how to export Driverless AI experiments to H2O MLOps from the Projects page, see the official H2O MLOps documentation.
Projects listing page options
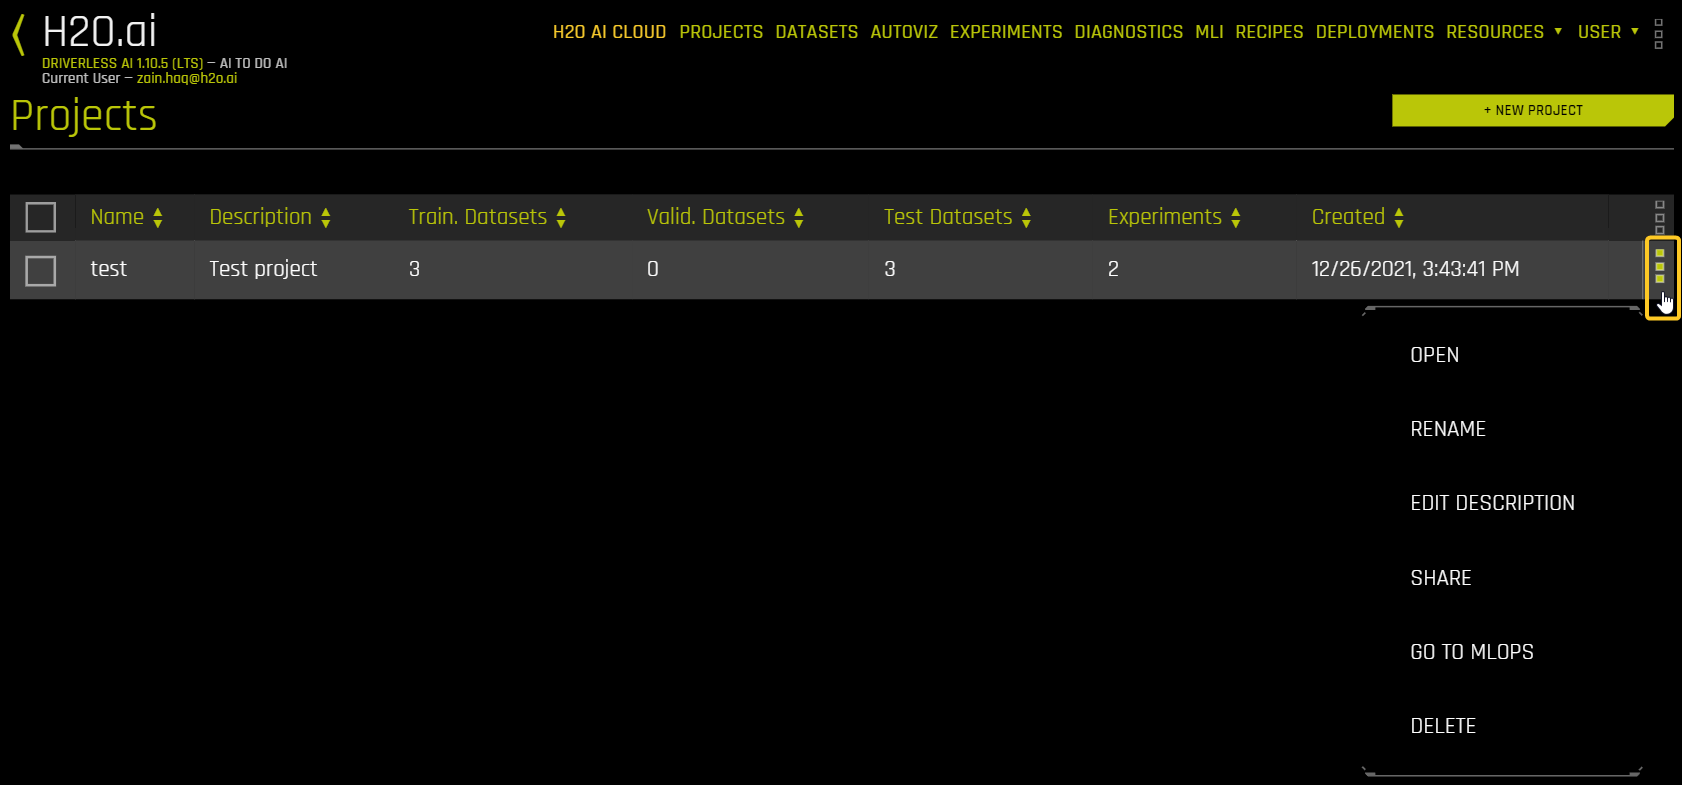
The following is a list of options that are available from the Projects listing page.
Open: Open the Project page for the project.
Rename: Rename the project.
Edit description: Edit the description for the project.
Share: Share the project with other users. For more information, see Sharing With Other Users.
Go to MLOps: View the project in the MLOps Wave app.
Delete: Delete the project.
Creating a Project Workspace
To create a Project Workspace:
Click the Projects option on the top menu. The Projects listing page is displayed.
Click New Project.
Note
When H2O AI Cloud workspace integration is enabled, project creation behavior depends on your configuration:
Single-project mode: Project creation is disabled; you work within the configured workspace
Multi-project mode: Creating a project creates a new workspace in H2O AI Cloud
Standalone mode: Projects are created locally
For more information, see H2O AI Cloud (HAIC) workspace integration.
Specify a name for the project and provide a description.
Click Create Project. This creates an empty Project page.
From the Project page, you can link datasets and/or experiments, run new experiments, and score experiments on a scoring dataset. When you link an existing experiment to a Project, the datasets used for the experiment are automatically linked to the project (if not already linked).
Linking Datasets
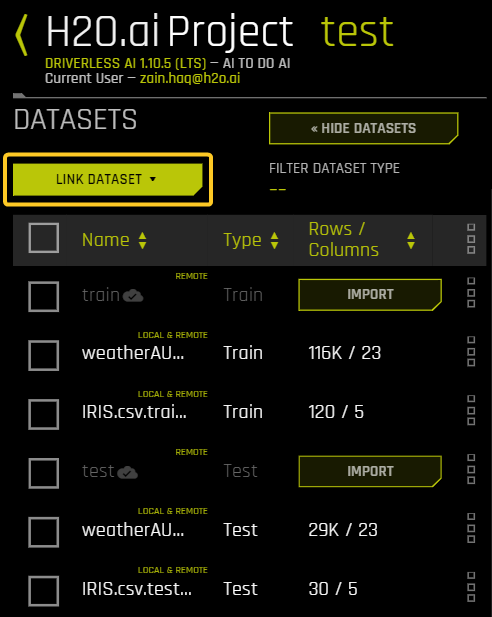
Any dataset that has been added to Driverless AI can be linked to a project. If you link an experiment to the project, you are prompted to download the datasets associated with that experiment. Note that each linked dataset is tagged with either Local, Remote, or Local & Remote to indicate whether the dataset exists in local storage, remote storage, or both.
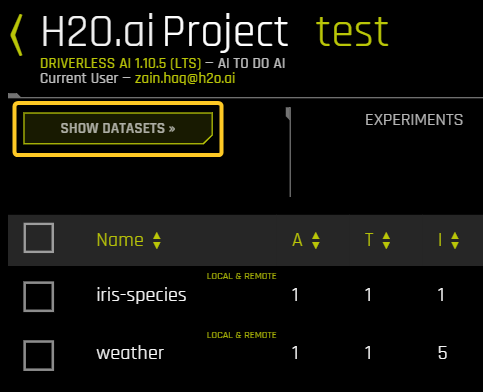
The following steps describe how to link a dataset to a project.
Click the Show Datasets button.
Click the Link Dataset button, then select the type of dataset you want to upload. Choose from Training, Testing, and Validation.
Select the dataset(s) that you want to link.
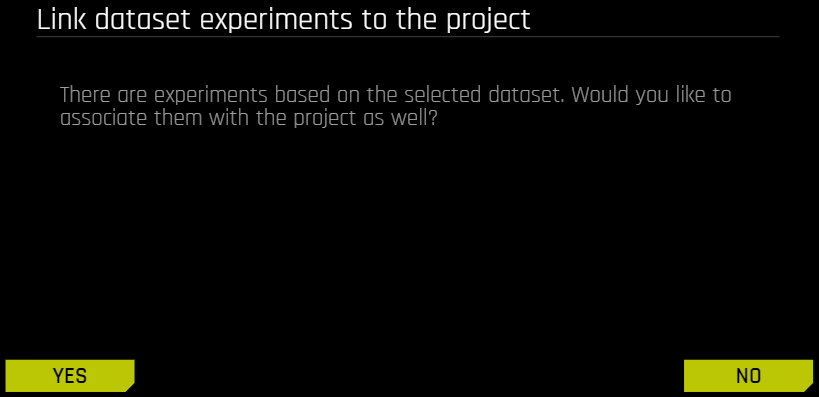
(Optional) If there are any completed experiments that are based on the selected dataset(s), you can choose to link them as well.
(Optional) To filter the list of linked datasets by type, click Filter Dataset Type and select the type of dataset you want to view. Choose from Training, Testing, and Validation.
When datasets are linked, the same menu options are available here as on the Datasets page. For more information, refer to Datasets in Driverless AI.
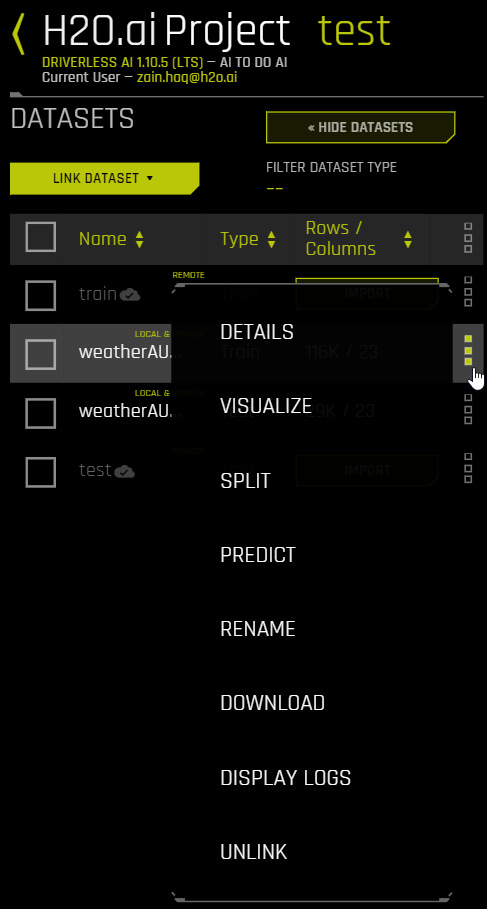
Selecting Datasets
In the Datasets section, you can select a training, validation, or testing dataset. The Experiments section shows experiments in the Project that use the selected dataset.
Linking Experiments
Existing experiments can be selected and linked to a Project. Additionally, you can run new experiments or checkpoint existing experiments from this page. Experiments started from the Project page are automatically linked to the Project.
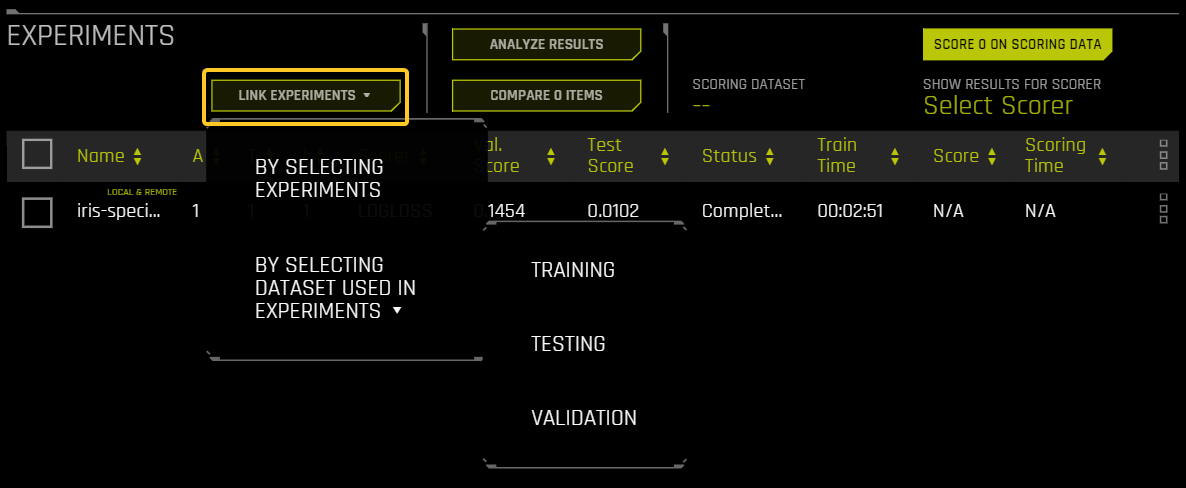
To link an existing experiment to the project, click Link Experiments and select one of the following options:
By Selecting Experiments: Select one or more experiments to link to the Project.
By Selecting Dataset Used in Experiments: Upload all experiments that used the selected dataset as a Training, Testing, or Validation dataset. For example, if you select By Selecting Dataset Used in Experiments > Training and then select the dataset
example-dataset.csv, all the experiments that used theexample-dataset.csvas a training dataset are linked.
New Experiments
When experiments are run from within a Project, only linked datasets or datasets available on the file system can be used.
Click the New Experiment link to begin a new experiment.
Select your training data and optionally your validation and/or testing data.
Specify your desired experiment settings (refer to Experiment Settings and Expert Settings), and then click Launch Experiment.
As the experiment is running, it will be listed at the top of the Experiments Leaderboard until it is completed. It will also be available on the Experiments page.
Checkpointing Experiments
When experiments are linked to a Project, the same checkpointing options for experiments are available here as on the Experiments page. Refer to Checkpointing, Rerunning, and Retraining for more information.
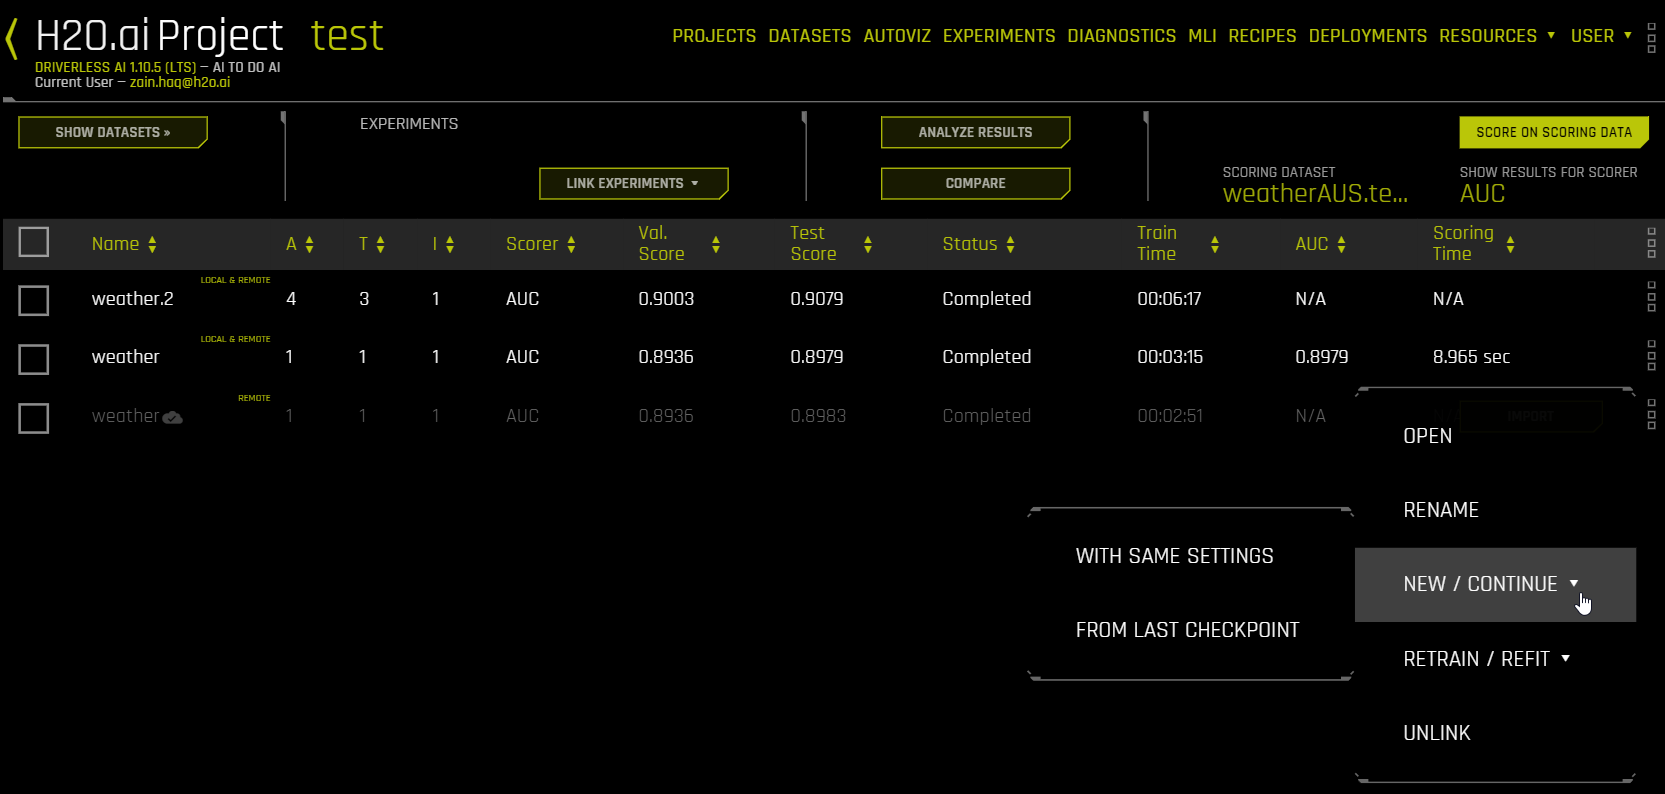
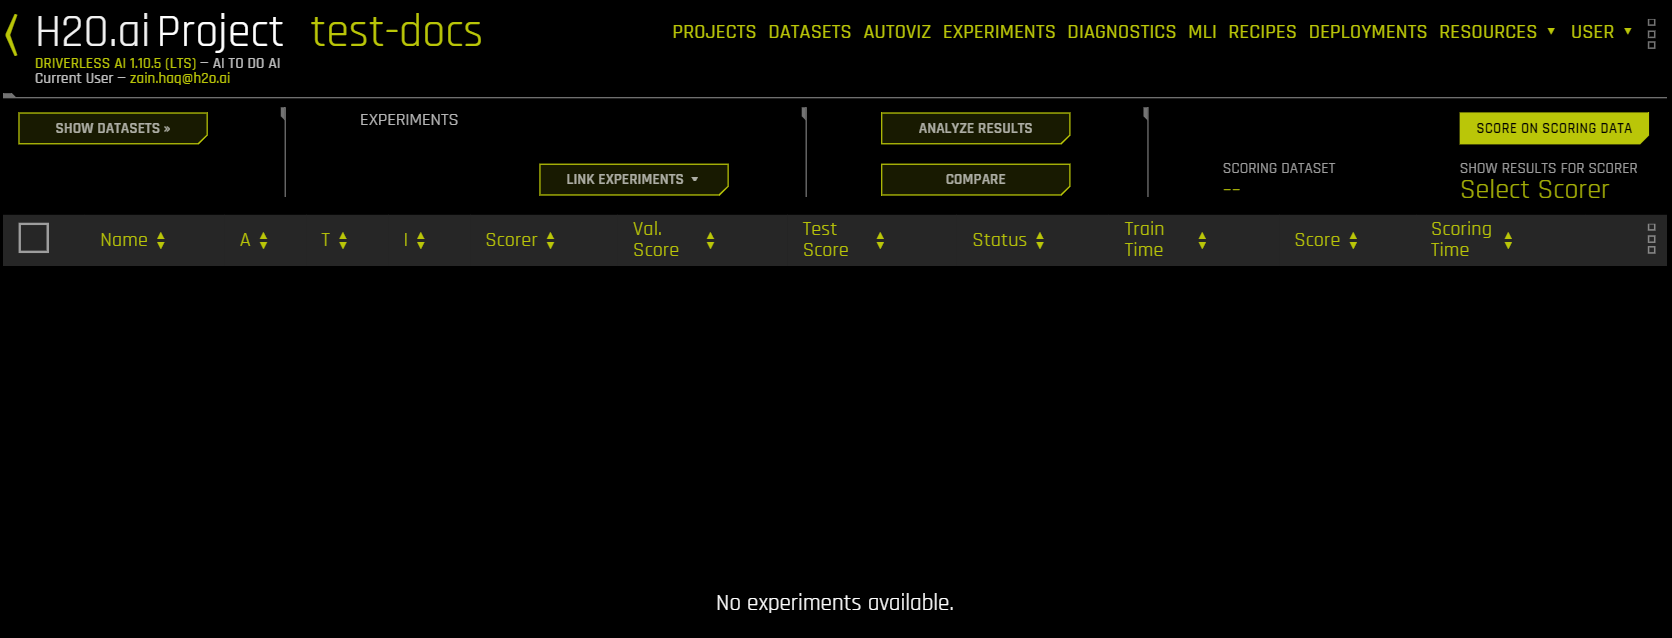
Experiments List
When attempting to solve a business problem, a normal workflow will include running multiple experiments, either with different/new data or with a variety of settings, and the optimal solution can vary for different users and/or business problems. For some users, the model with the highest accuracy for validation and test data could be the most optimal one. Other users might be willing to make an acceptable compromise on the accuracy of the model for a model with greater performance (faster prediction). For some, it could also mean how quickly the model could be trained with acceptable levels of accuracy. The Experiments list allows you to find the best solution for your business problem.
The list is organized based on experiment name. You can change the sorting of experiments by selecting the up/down arrows beside a column heading in the experiment menu.
Hover over the right menu of an experiment to view additional information about the experiment, including the problem type, datasets used, and the target column.
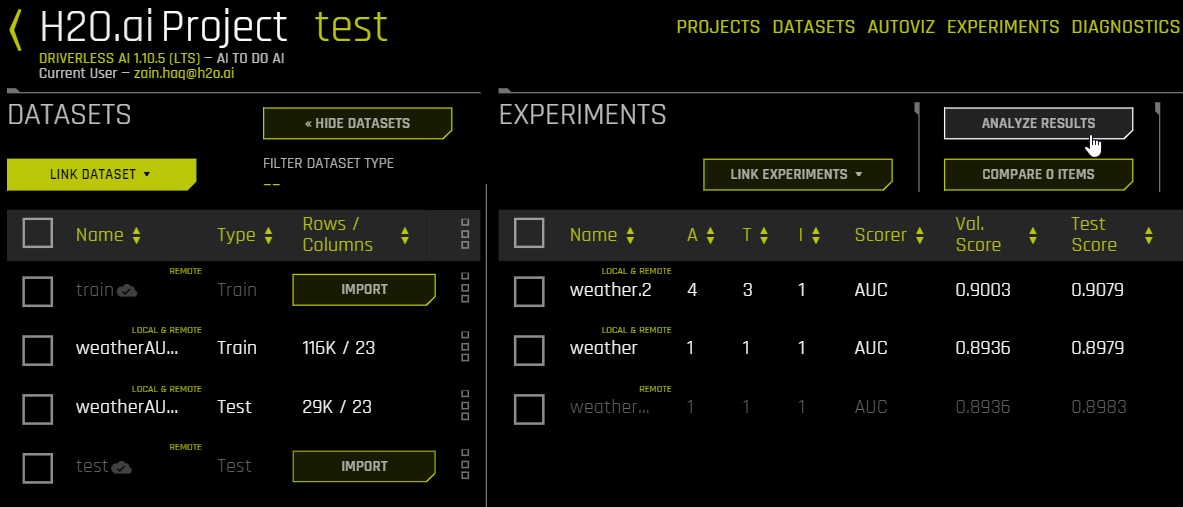
Experiment Scoring
Finished experiments linked to the project show their validation and test scores. You can also score experiments on other datasets. To do this, you first need to add a dataset by clicking the Link Dataset button and choosing Testing from the drop-down menu. After the test dataset has been added, click the Score on Scoring Data button and choose the experiment(s) that you want to score along with the test dataset to be applied. This triggers a diagnostics job, the results of which are located on the diagnostics page. (Refer to Diagnosing a Model for more information.) After the scoring process has completed, the result appears in the Score and Scoring Time columns. The Score column shows results for the scorer specified by the Show Results for Scorer picker.
Notes:
If an experiment has already been scored on a dataset, Driverless AI cannot score it again. The scoring step is deterministic, so for a particular test dataset and experiment combination, the score will be same regardless of how many times you repeat it.
The test dataset must have all the columns that are expected by the various experiments you are scoring it on. However, the columns of the test dataset need not be exactly the same as input features expected by the experiment. There can be additional columns in the test dataset. If these columns were not used for training, they will be ignored. This feature gives you the ability to train experiments on different training datasets (i.e., having different features), and if you have an “uber test dataset” that includes all these feature columns, then you can use the same dataset to score these experiments.
A Test Time column is available in the Experiments Leaderboard. This value shows the total time (in seconds) that it took for calculating the experiment scores for all applicable scorers for the experiment type. This is valuable to users who need to estimate the runtime performance of an experiment.
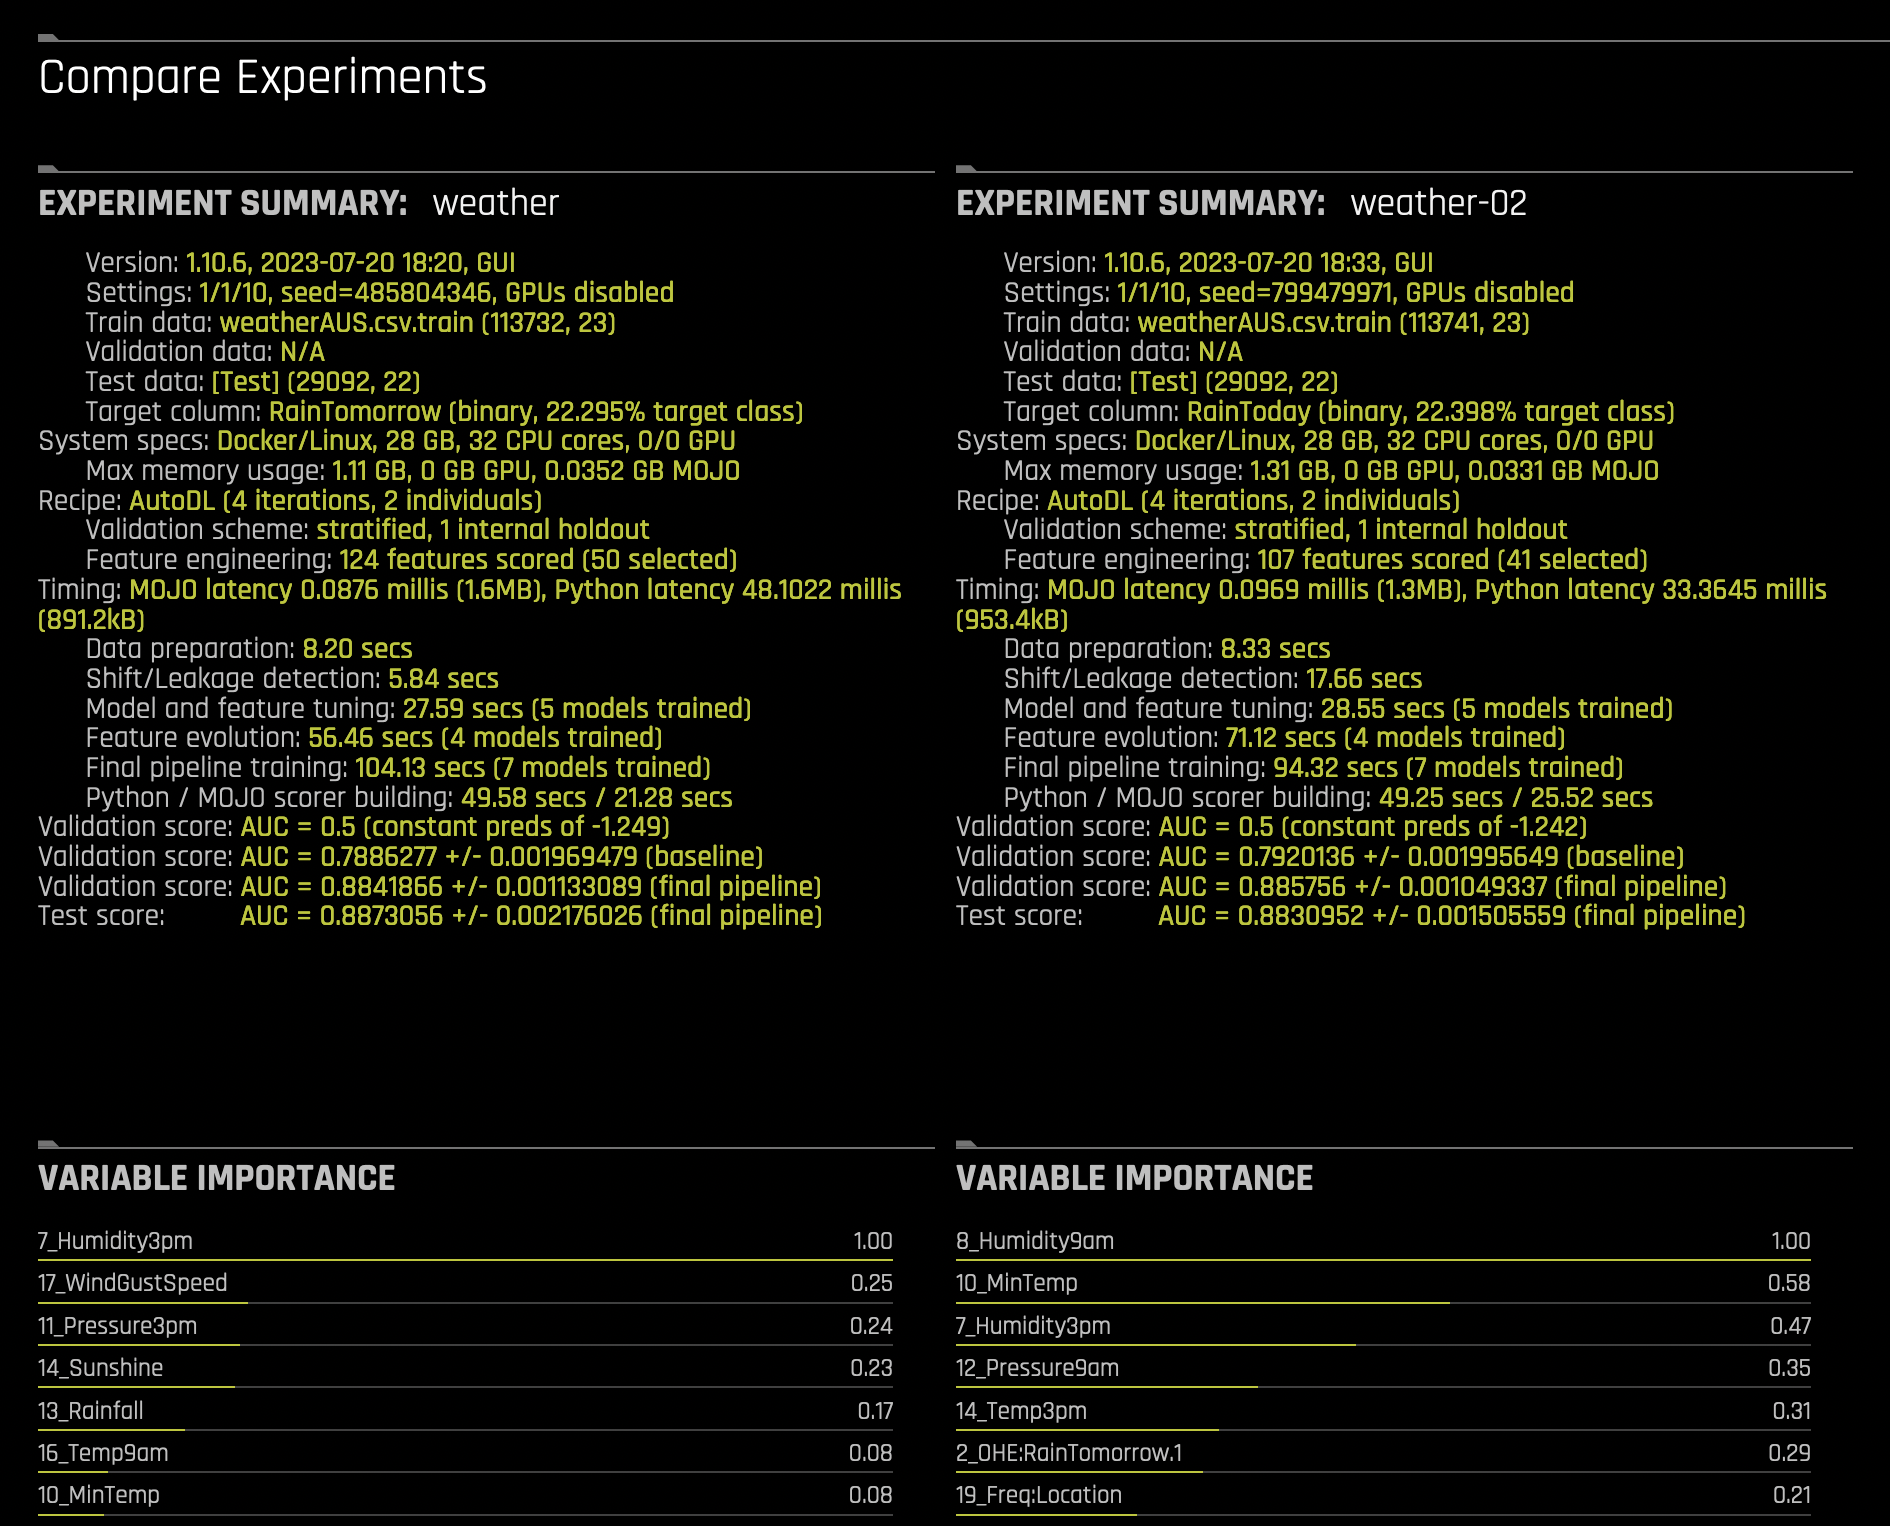
Comparing Experiments
You can compare two or three experiments and view side-by-side detailed information about each.
Select either two or three experiments that you want to compare. You cannot compare more than three experiments.
Click the Compare n Items button.
This opens the Compare Experiments page. This page includes the experiment summary and metric plots for each experiment. The metric plots vary depending on whether this is a classification or regression experiment.
For classification experiments, this page includes:
Variable Importance list
Confusion Matrix
ROC Curve
Precision Recall Curve
Lift Chart
Gains Chart
Kolmogorov-Smirnov Chart
For regression experiments, this page includes:
Variable Importance list
Actual vs. Predicted Graph
Experiment tagging
The following steps describe how to add tags to experiments that have been linked to a Project.
Notes:
To use the tagging functionality, the experiment needs to be linked to H2O Storage (remote storage).
An experiment can only be tagged after it has completed.
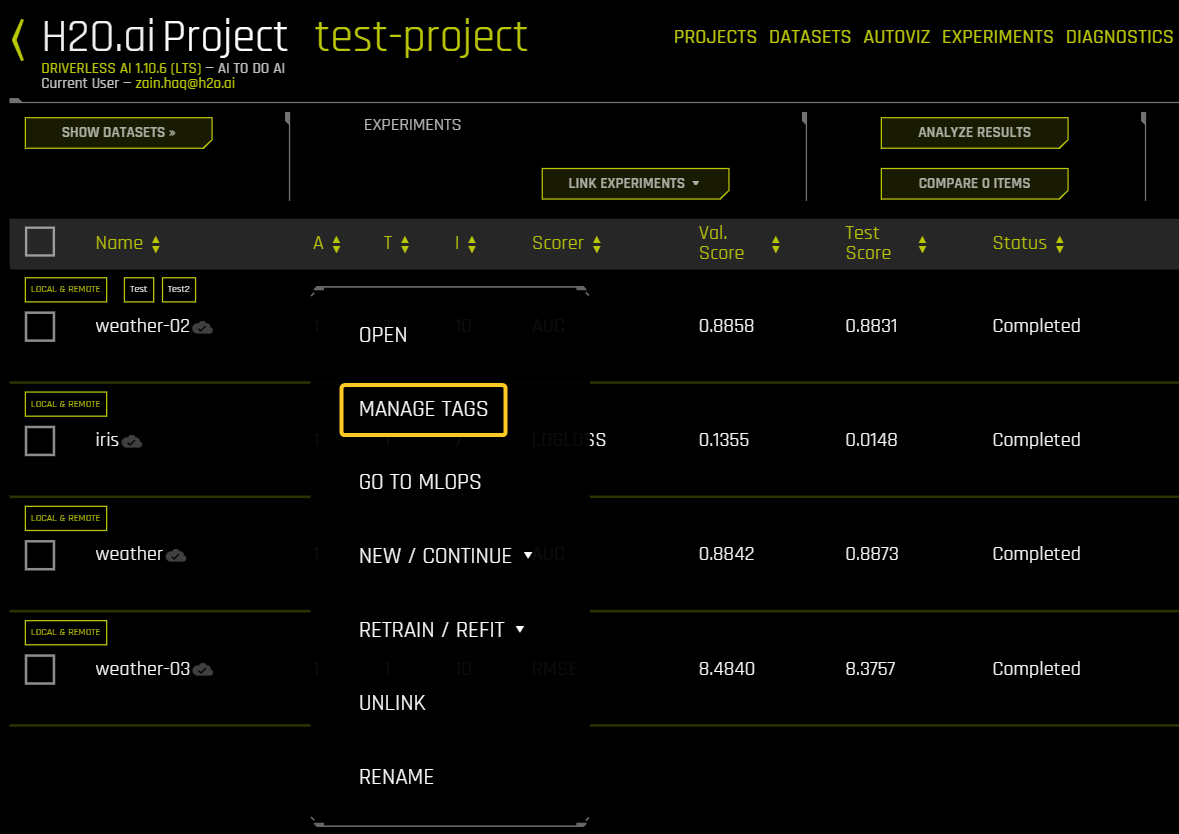
Right click an experiment listed on the Project page, and then click Manage Tags. The Tags panel is displayed.
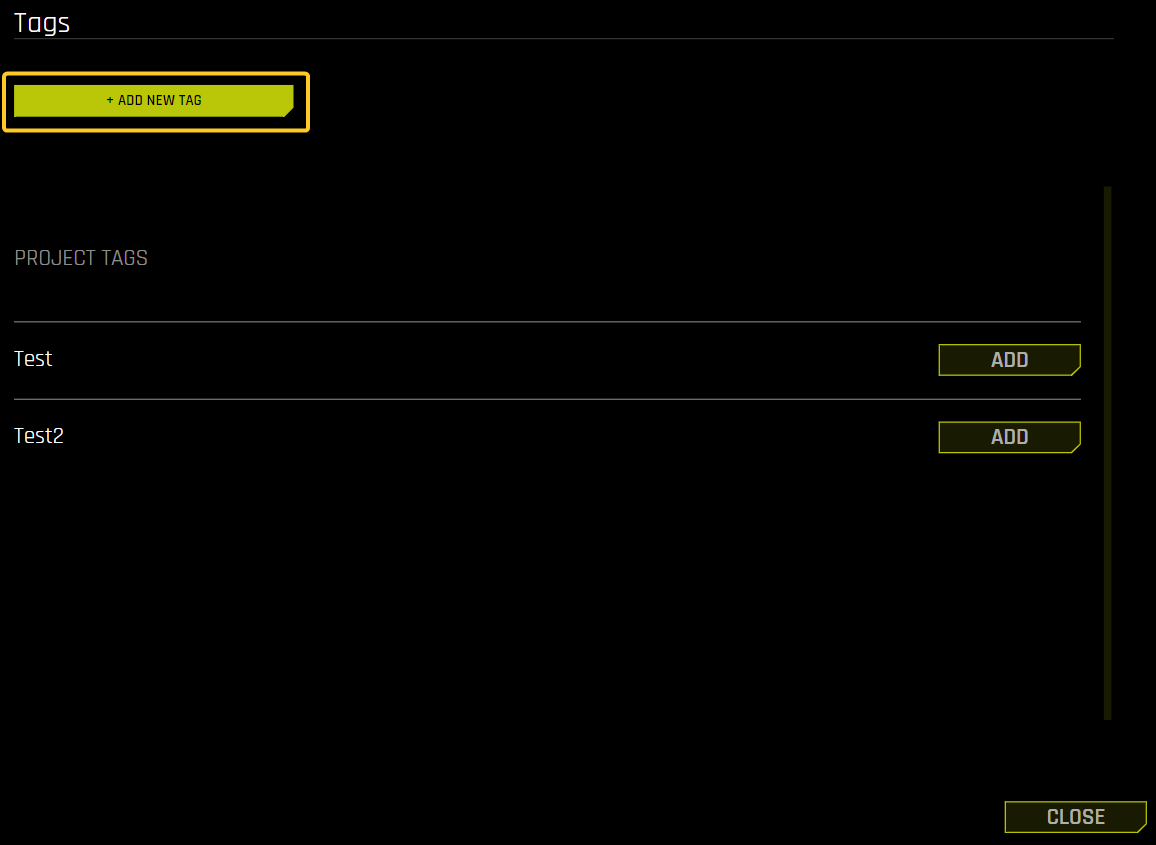
Click the Add New Tag button.
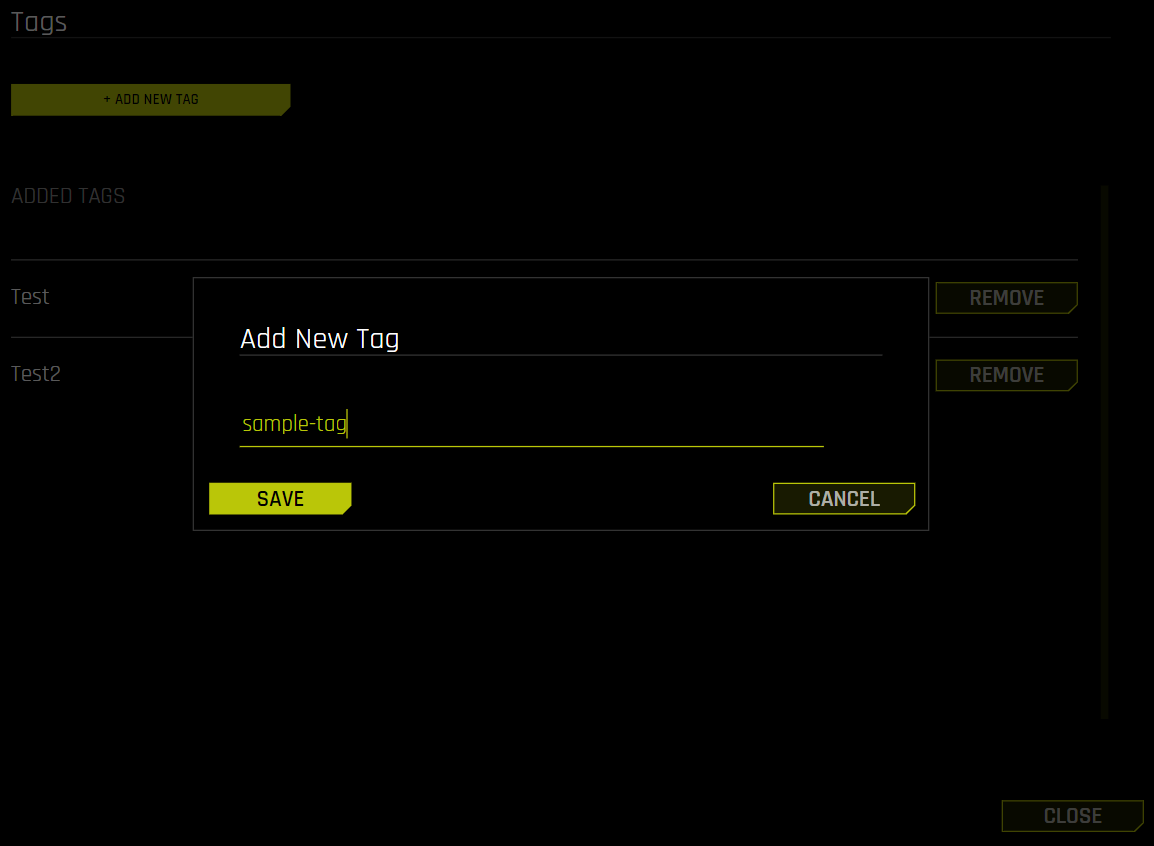
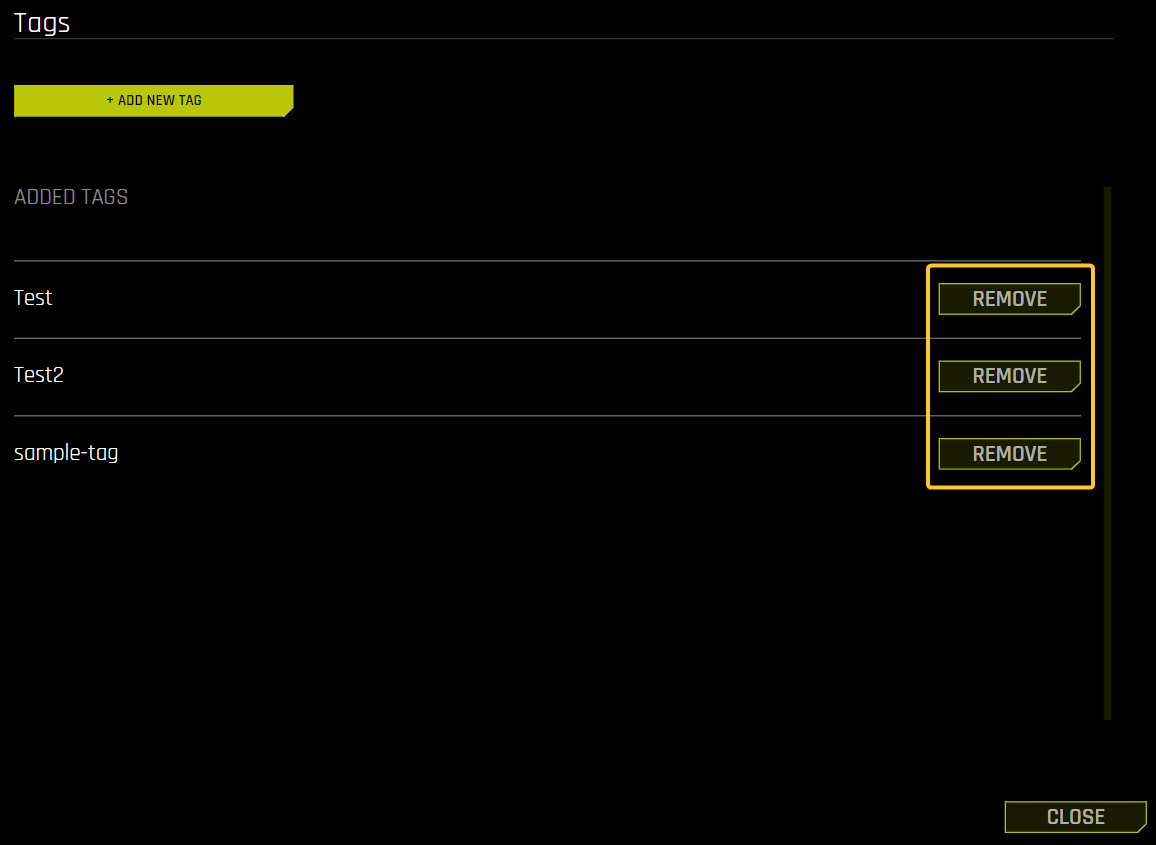
Enter the tag name and click the Save button. The new tag appears in the list of Added Tags in the Tags panel.
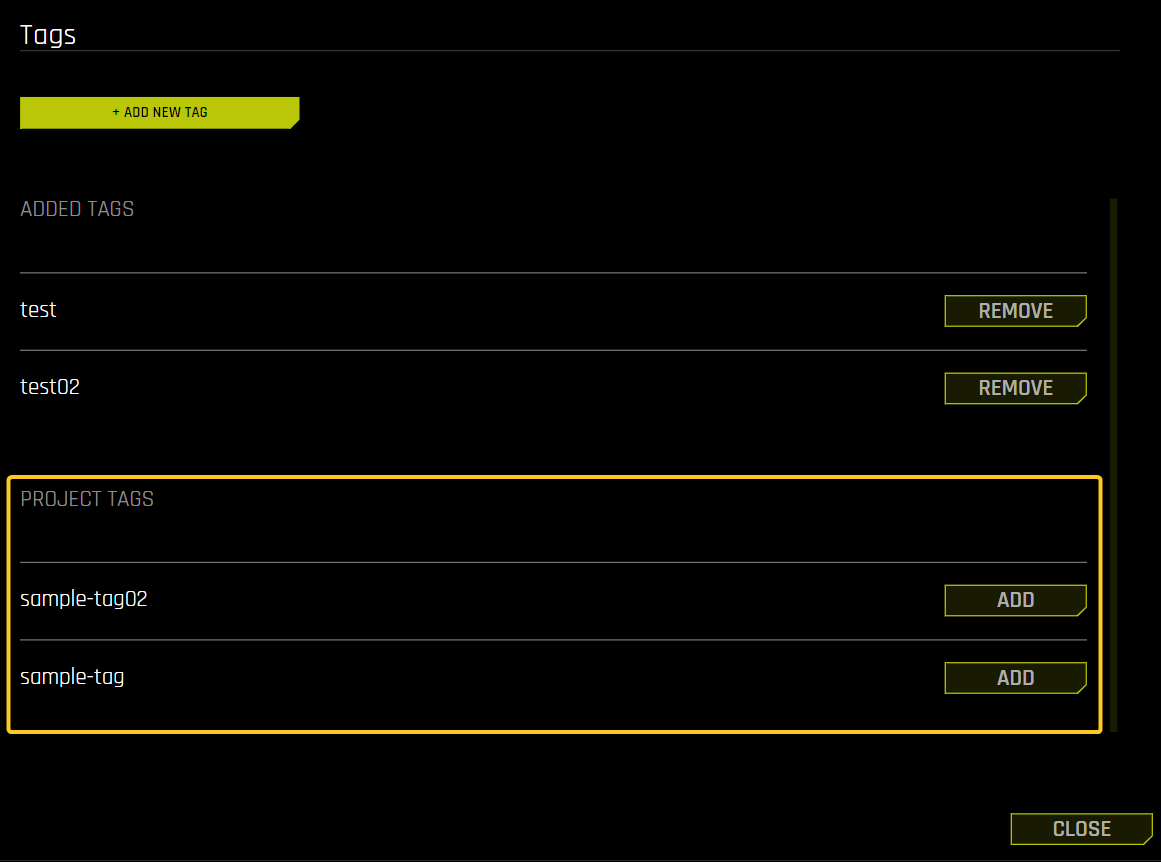
Note that tags that exist within the Project but have not been applied to a given experiment are listed in the Tags panel as Project Tags. This means that you can add existing tags to different experiments without having to add them multiple times.
Remove tags
The following steps describe how to remove tags from an experiment.
Right click an experiment listed on the Project page, and then click Manage Tags. The Tags panel is displayed.
Click the Remove button next to the tag you want to remove. Note that removed tags are still available in the Project Tags section of the Tags panel.
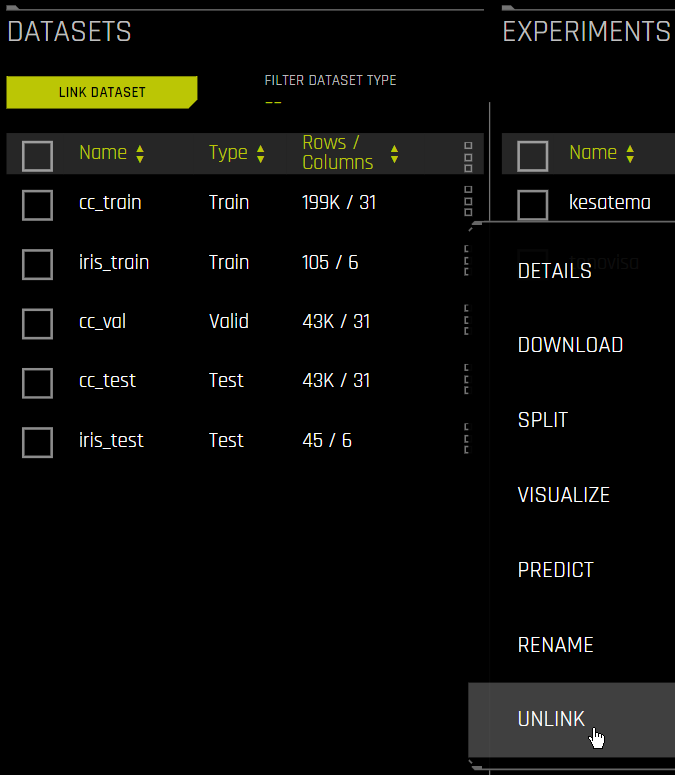
Unlinking Data on a Projects Page
Unlinking datasets and/or experiments does not delete that data from Driverless AI. The datasets and experiments will still be available on the Datasets and Experiments pages.
Unlink a dataset by clicking on the dataset and selecting Unlink from the menu. Note: You cannot unlink datasets that are tied to experiments in the same project.
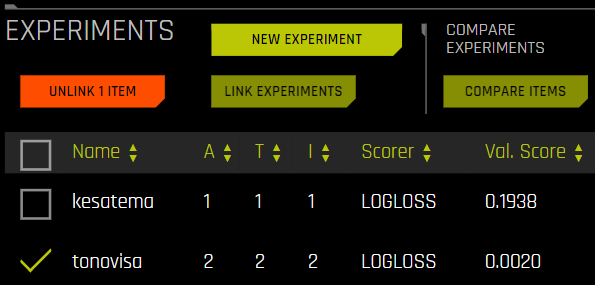
Unlink an experiment by selecting the experiment and clicking the Unlink Item button. Note that this will not automatically unlink datasets that were tied to the experiment.
Deleting Projects
To delete a project, click the Projects option on the top menu to open the main Projects page. Click the dotted menu the right-most column, and then select Delete. You will be prompted to confirm the deletion.
Note that deleting projects does not delete datasets and experiments from Driverless AI. Any datasets and experiments from deleted projects will still be available on the Datasets and Experiments pages.
Leaderboard Wizard: Business value calculator
From the Project page, you can access a business value calculator wizard by clicking the Analyze Results button. This wizard makes it simple to perform a business value analysis for all models in a given project. Note that this feature is only supported for classification experiments.
The Leaderboard Wizard lets you assign the business value of correctly and incorrectly predicted outcomes. By default, a correct classification is worth 1, and an incorrect classification is worth -1 (in arbitrary units), but you can edit these values as needed.
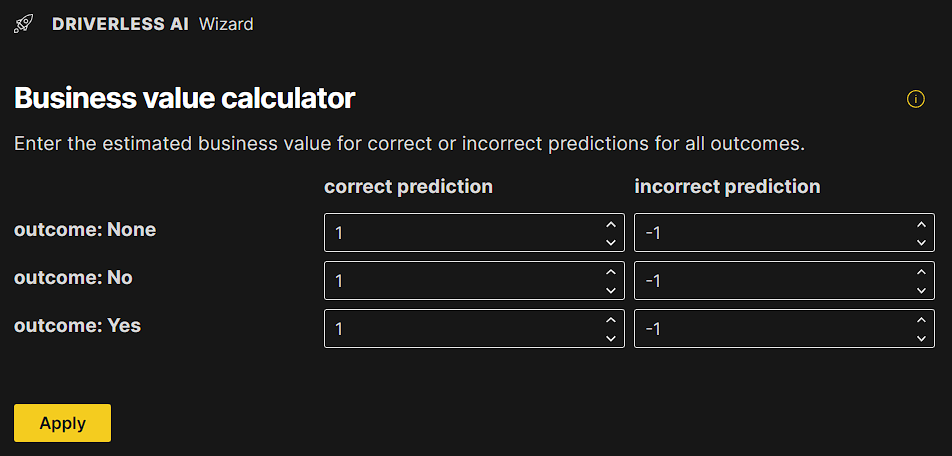
For leaderboards of experiments, experiments are ranked by the net business value they provide on the test set.
Note: For information about the Experiment and Dataset Join wizards, see H2O Driverless AI Experiment Setup Wizard and Dataset Join Wizard.