Models
Overview
The Models page allows you to explore the supported large language models (LLMs) and perform self-tests on the LLMs used throughout Enterprise h2oGPTe.
Administrators can configure custom models through the System Settings page. For detailed instructions, see Configure custom models.
Supported LLMs
Enterprise h2oGPTe supports the following LLMs:
 Major Providers
 Research Labs
 Enterprise & Other
 Meta
Meta
- meta-llama/Meta-Llama-3.1-8B-Instruct
- meta-llama/Meta-Llama-3.1-70B-Instruct
- meta-llama/Meta-Llama-3.1-405B-Instruct-FP8
- meta-llama/Llama-3.3-70B-Instruct
- meta-llama/Llama-Guard-3-8B
- meta-llama/Llama-3-8b-chat-hf
- meta-llama/Llama-3-70b-chat-hf
- meta-llama/Meta-Llama-3.1-8B-Instruct-Turbo
- meta-llama/Meta-Llama-3.1-70B-Instruct-Turbo
- meta-llama/Meta-Llama-3.1-405B-Instruct-Turbo
- meta-llama/Llama-3.2-3B-Instruct-Turbo
- meta-llama/Llama-3.2-11B-Vision-Instruct-Turbo
- meta-llama/Llama-3.2-90B-Vision-Instruct-Turbo
- meta-llama/Llama-4-Scout-17B-16E-Instruct
- meta-llama/Llama-4-Maverick-17B-128E-Instruct-FP8
 OpenAI
- gpt-4o
- gpt-4o-mini
- gpt-4.1
- gpt-4.1-mini
- gpt-4.1-nano
- gpt-4.5-preview
- gpt-5
- gpt-5-mini
- gpt-5-nano
- gpt-5-chat
- gpt-5-codex
- o1
- o1-mini
- o1-preview
- o3
- o3-mini
- o4-mini
 Google
- google/gemma-2-27b-it
- gemini-1.5-pro-latest
- gemini-2.0-flash
- gemini-2.0-flash-thinking-exp-01-21
- gemini-2.0-pro-exp-02-05
- gemini-2.5-flash-preview-05-20
- gemini-2.5-pro-preview-06-05
- gemini-2.5-pro-exp-05-06
- gemini-2.5-pro
- gemini-2.5-pro (Vertex AI)
- gemini-2.5-flash
 Anthropic
- claude-3-5-haiku-20241022
- claude-3-5-sonnet-20241022
- claude-3-7-sonnet-20250219
- claude-sonnet-4-20250514
- claude-opus-4-20250514
 Mistral AI
 Qwen (Alibaba Cloud)
- Qwen/Qwen1.5-72B-Chat
- Qwen/Qwen2-72B-Instruct
- Qwen/Qwen2-VL-7B-Instruct
- Qwen/Qwen2.5-72B-Instruct
- Qwen/Qwen2.5-VL-72B-Instruct
- Qwen/QwQ-32B
- Qwen/Qwen3-235B-A22B-FP8
- Qwen/Qwen3-Coder-480B-A35B-Instruct-FP8
 DeepSeek AI
- deepseek-ai/DeepSeek-V3
- deepseek-ai/DeepSeek-R1
- deepseek-ai/deepseek-llm-67b-chat
- deepseek-ai/DeepSeek-R1-Distill-Qwen-32B
- deepseek-ai/DeepSeek-R1-0528
- deepseek-chat
- deepseek-reasoner
 NVIDIA
Other Models
- h2oai/h2o-danube2-1.8b-chat
- h2oai/h2o-danube3-4b-chat
- h2oai/h2ovl-mississippi-2b
- microsoft/Phi-3-mini-128k-instruct
- microsoft/Phi-3-medium-128k-instruct
- microsoft/Phi-3-vision-128k-instruct
- MiniMax-Text-01
- NousResearch/Nous-Capybara-34B
- NousResearch/Nous-Hermes-2-Mixtral-8x7B-DPO
- openchat/openchat-3.5-1210
- OpenGVLab/InternVL-Chat-V1-5
- OpenGVLab/InternVL2-Llama3-76B
- perplexity-ai/r1-1776
- upstage/SOLAR-10.7B-Instruct-v1.0
- openai/gpt-oss-120b
- grok-4
and many more. Our latest RAG benchmark results lists all tested models: RAG benchmark results.
The table inside the LLMs tab renders the supported LLMs.
Run self-tests
Overview
A self-test enables you to evaluate the LLMs used across Enterprise h2oGPTe to generate a response to a query and process and summarize a Document.
To ensure system stability and prevent resource conflicts, only one self-test can be run for a specific LLM at any given time across the entire system. If you attempt to start a test for an LLM that is already being tested (even by another user), the new test will not be submitted until the current one is complete.
Instructions
To run a self-test, consider the following steps:
- In the Enterprise h2oGPTe navigation menu, click Models.
- Click Run self-tests.
- In the Run self-tests list, select a self-test.
options
- Quick test (chat-like short query): This self-test evaluates the model's ability to respond to brief, conversational queries accurately and contextually.
- RAG test (large context query): This self-test evaluates the model's ability to understand and respond accurately to queries that require it to process and maintain a long context or multiple pieces of information over an extended conversation.
- Full test (full context query): This self-test evaluates the model's ability to understand, retain, and use the information provided across a conversation to respond to complex, multi-part queries. It requires the model to keep track of various details and offer responses that synthesize all the given information. This option is only available to an admin.
- Stress test (repeated full test): This self-test evaluates the model's consistency, accuracy, and contextual awareness over multiple interactions on the same topic. It ensures the model can handle information continuity over several sessions, maintaining the context and providing accurate responses. This option is only available to an admin.
- (Conditional step) If you selected Full test or Stress test, consider the following steps:
- Full test
- In the Run full tests box, click Run tests.
- Stress test
- In the Run stress tests box, click Run tests.
- Full test
Tabs
LLMs
Overview
The LLMs tab contains a table rendering the large language models (LLMs) supported for generating responses to user queries and summarizing and processing documents.

Instructions
To access the LLMs tab, consider the following steps:
- In the Enterprise h2oGPTe navigation menu, click Models.
Charts
Overview
The chart in the Charts tab allows you to compare various models across several selected metrics by adjusting its x and y axes to these metrics. These models generate responses to user queries and summarize and process Documents.
For example, in the image below, the chart compares the performance and usage characteristics of various large language models (LLMs). The x-axis shows the estimated typical cost per query (in USD), while the y-axis displays the RAG benchmark accuracy percentage.
The chart includes several data points representing different LLMs, such as GPT-4, Meta-Llama, and Mistral. Each data point is labeled with the model name and some additional information, such as the version number or specific capabilities.
In this example, the top right of the chart indicates models with higher accuracy and higher cost per query, while the bottom left shows models with lower accuracy and lower cost per query.
The chart can be useful for researchers, developers, or users to compare the performance and cost-effectiveness of different large language models. This can help them select the most appropriate model for their needs or applications.
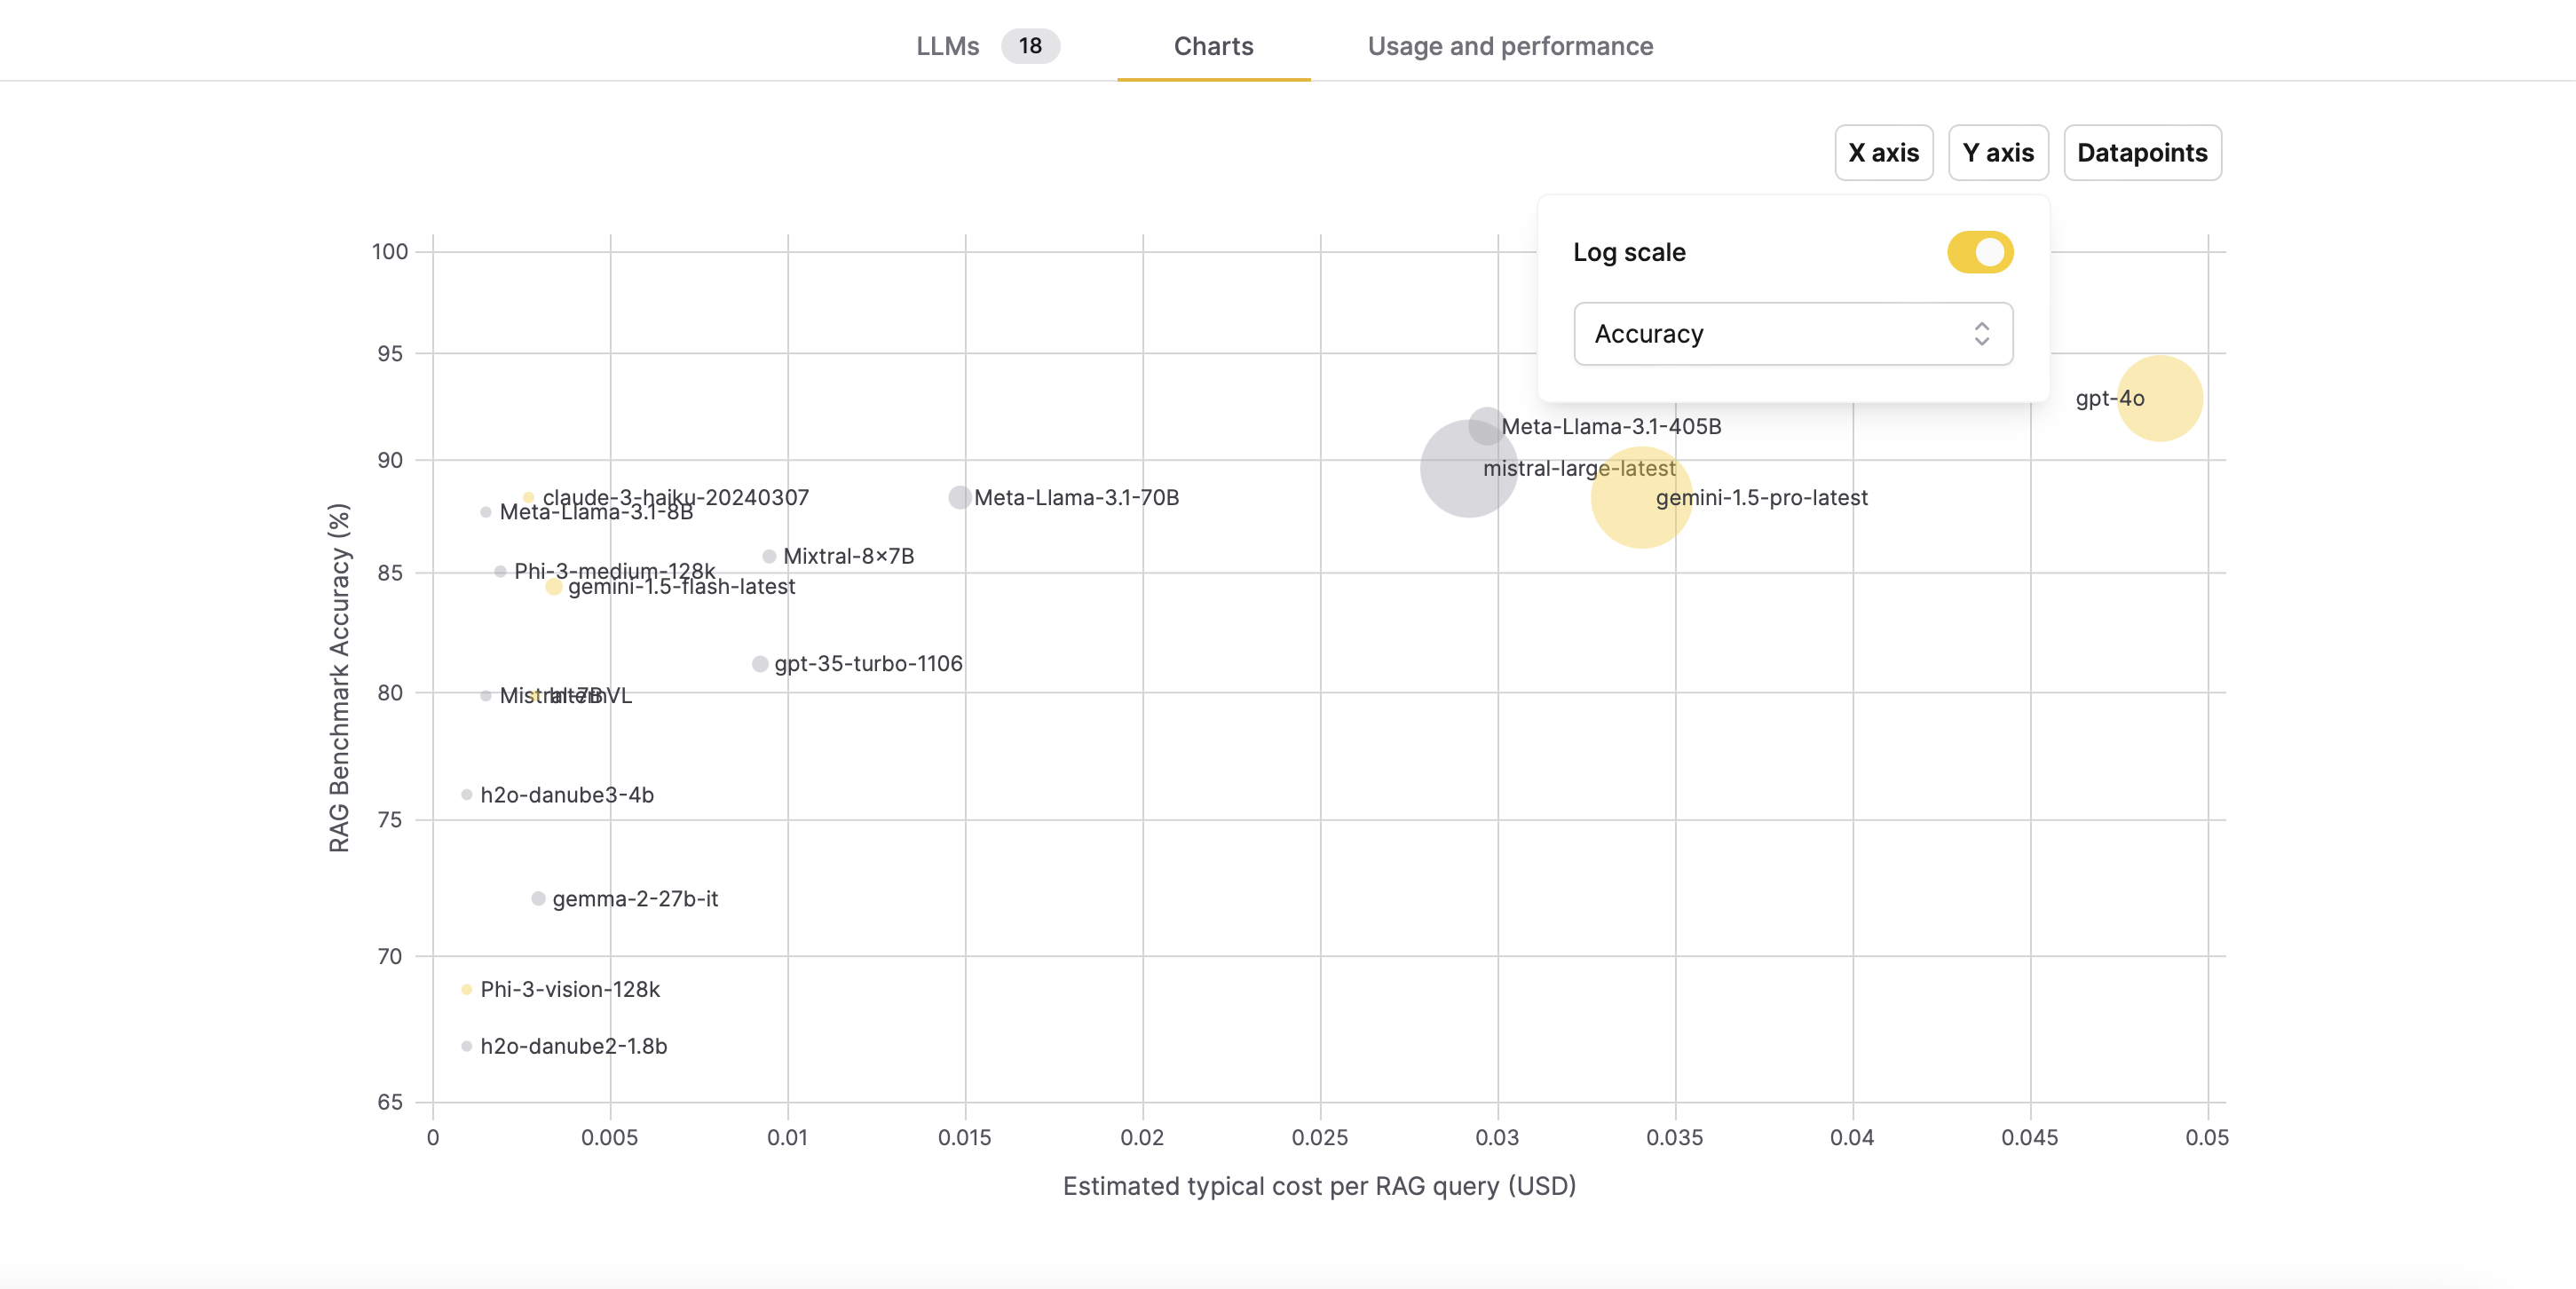
Log-scaling the x/y axis of the graph means transforming the x/y axis values using a logarithmic function. This transformation is particularly useful when dealing with data that spans several orders of magnitude, as it can help visualize the data more clearly by compressing the scale of large values and expanding the scale of small values.
Instructions
To access the Charts tab, consider the following steps:
- In the Enterprise h2oGPTe navigation menu, click Models.
- Click the Charts tab.
Usage and performance
Overview
The Usage and performance tab provides an overview of your approximated large language model (LLM) usage in the last 24 hours. The section includes details on quotas, cost estimates, and usage breakdown by specific LLMs.
The daily quotas and cost estimates are configured by administrators.
Instructions
To access the Usage and performance tab, consider the following steps:
- On Enterprise h2oGPTe navigation menu, click Models.
- Click the Usage and performance tab.
- Daily quota: The daily allocation for LLM usage.
- Percentage used: The percentage of the daily quota that has been utilized.
- Usage: The cost incurred for LLM usage within the last 24 hours.
- [Cost], [Speed], or [Latency] by LLM: This section covers the cost, speed, or latency of each LLM incurred in a given timeframe.
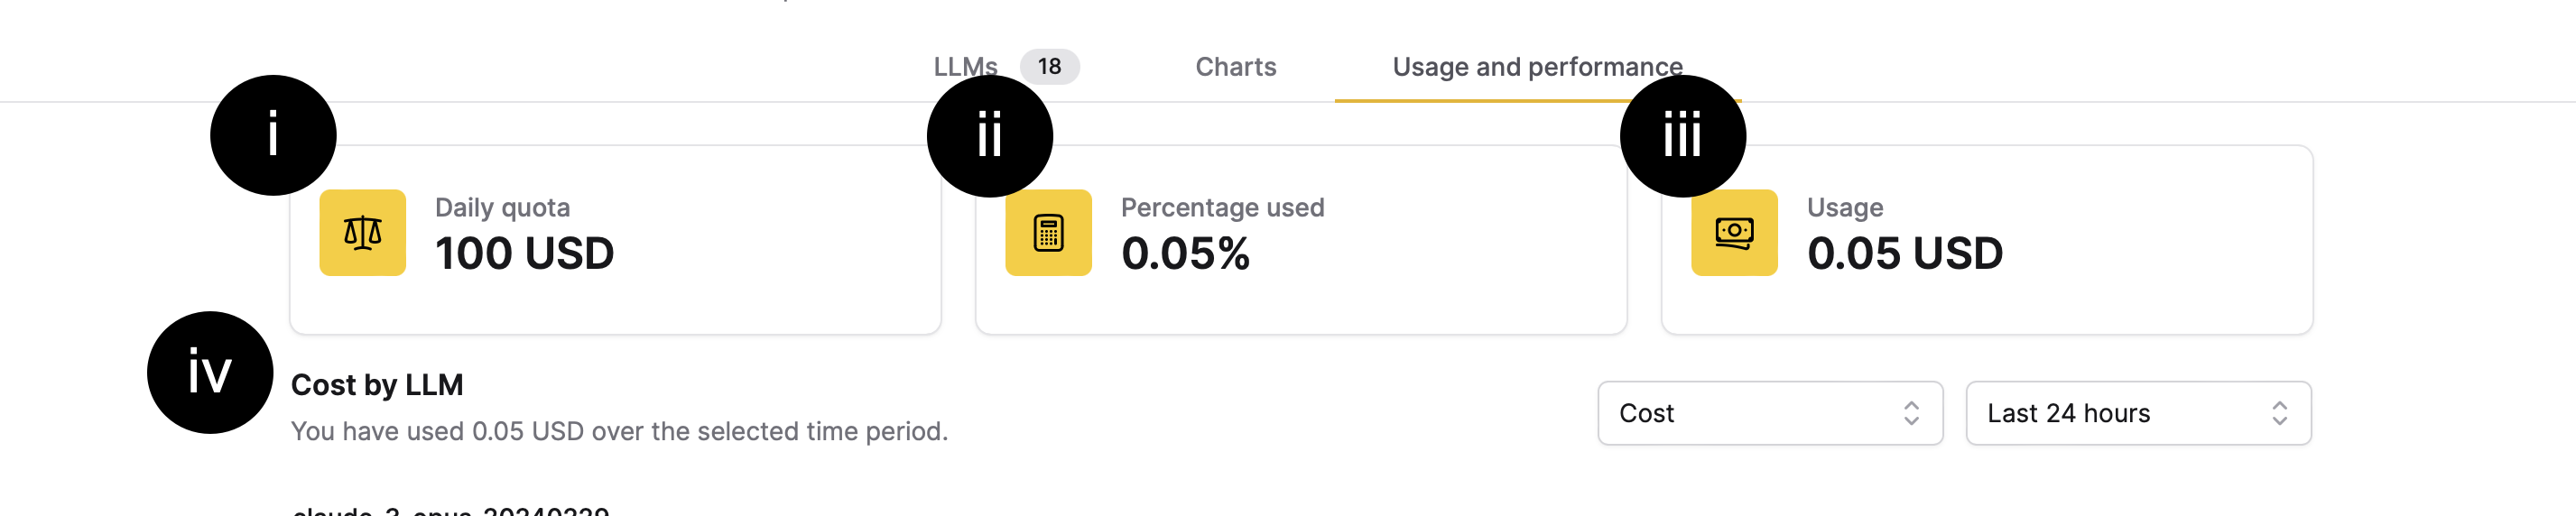
The [Cost], [Speed], or [Latency] by LLM section defaults to displaying usage within the last 24 hours. However, you can choose different time frames to see usage information within the Last hour, Last 24 hours, Last week, Last month, or All time.
- Submit and view feedback for this page
- Send feedback about Enterprise h2oGPTe to cloud-feedback@h2o.ai