eScorer insights
The eScorer insights page provides latency and error tracking for eScorer models in your H2O AI Managed Cloud (HAMC) environment. The page includes two tabs, Latency and Errors that help you monitor model performance and identify potential issues.
Click eScorer under Analytics on the left-navigation bar to open the eScorer insights page.
Telemetry data on this page is updated twice daily.
Filtering options
You can filter the data displayed on both tabs using the following options:
- Model: Select one or more models from the dropdown menu to view their performance data.
- Score mode: Select the score mode to filter results based on scoring methodology.
- Time period: Select a date range to analyze performance within a specific time frame.
The selected filters apply to both the Latency and Errors tabs, ensuring consistent data views across the page.

By applying filters, you can focus on specific models, score modes, or time periods to identify trends and address performance issues.
Latency
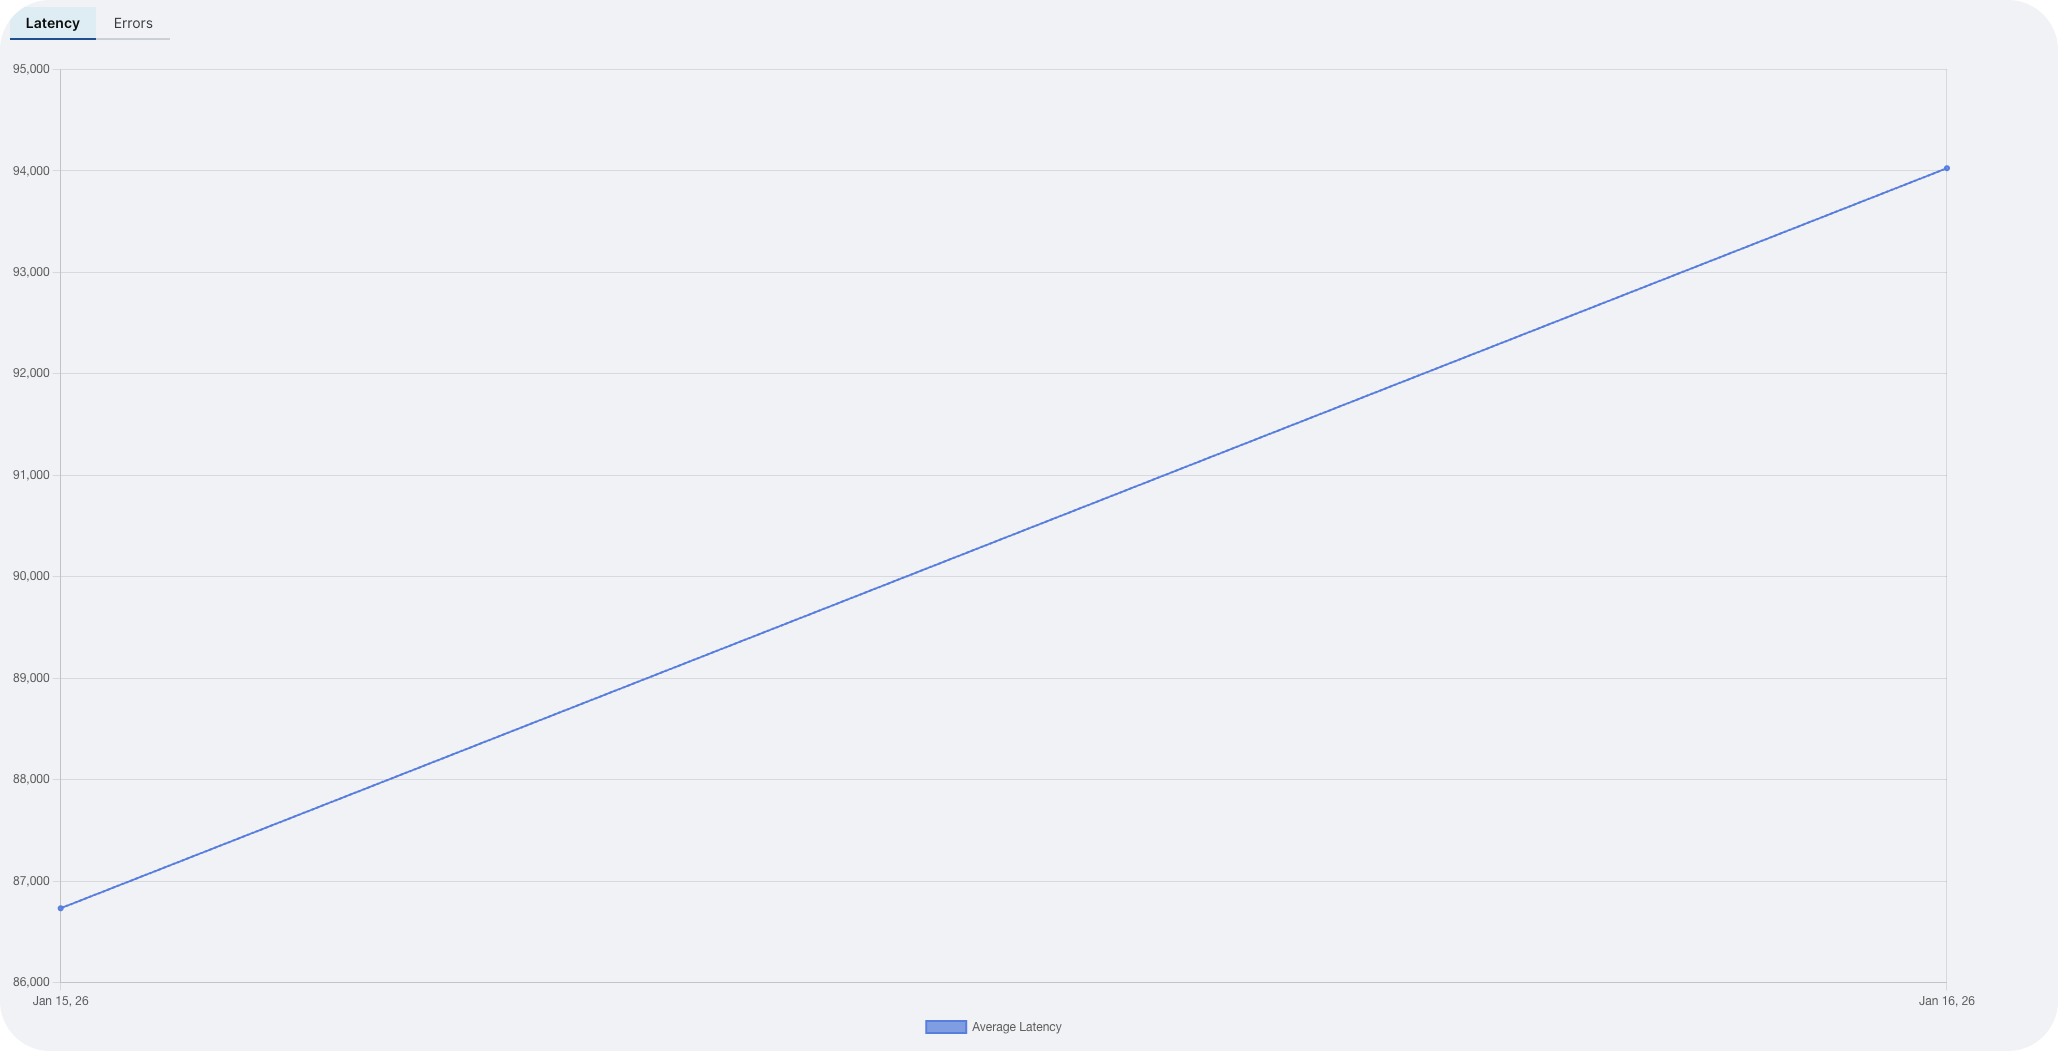
The Latency tab displays average latency metrics for your selected models and score modes over the specified time period.
Average latency chart
A line chart shows how the average latency of records has changed over time during the selected time range. Each line represents a different combination of model and score mode, making it easy to:
- Compare latency across different models
- Identify performance trends over time
- Spot potential performance degradation
Latency details table
The latency details table provides a breakdown of average latency data with the following columns:
- Date: The date for which latency data is recorded.
- Model name: The name of the eScorer model.
- Number of datapoints: The total number of records processed on that date.
- Score mode: The score mode used for the records.
- Average latency: The average latency in milliseconds for the specified combination.
Use this table to identify specific dates or model configurations with higher latency values.
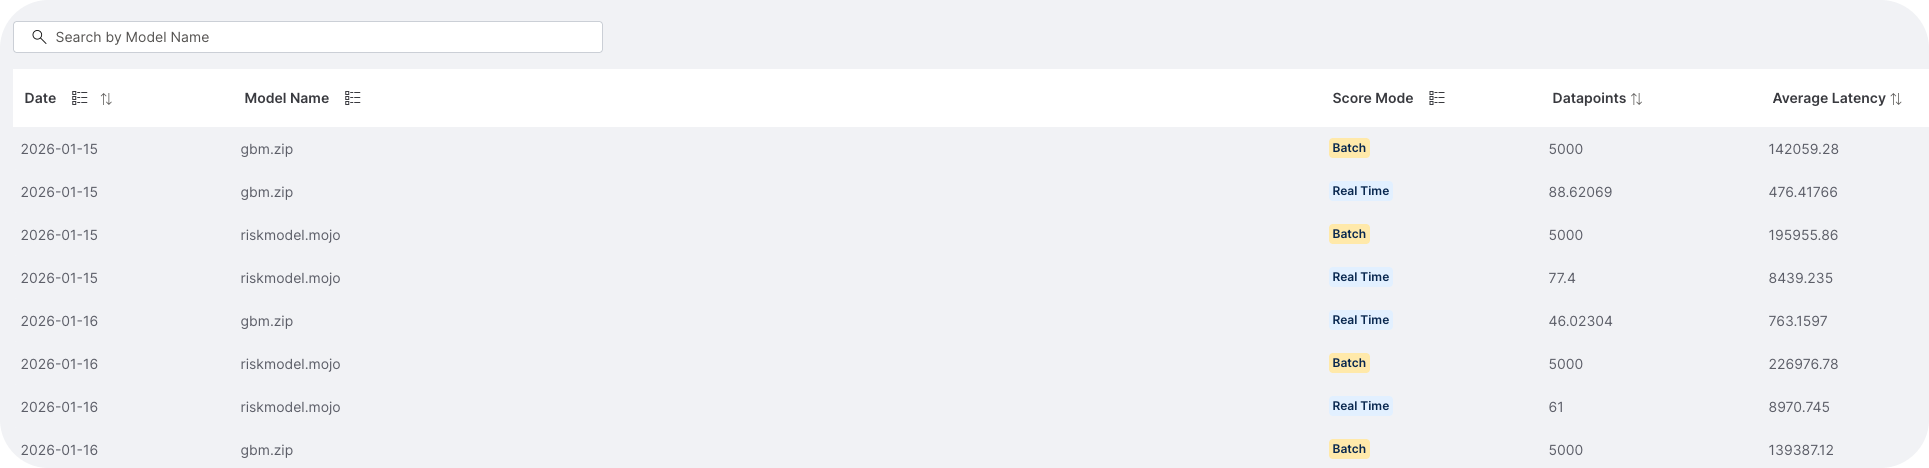
Lower latency values indicate better model performance. Use this data to optimize model configurations and score modes.
Errors
The Errors tab displays error occurrences and details for your selected models and score modes over the specified time period.
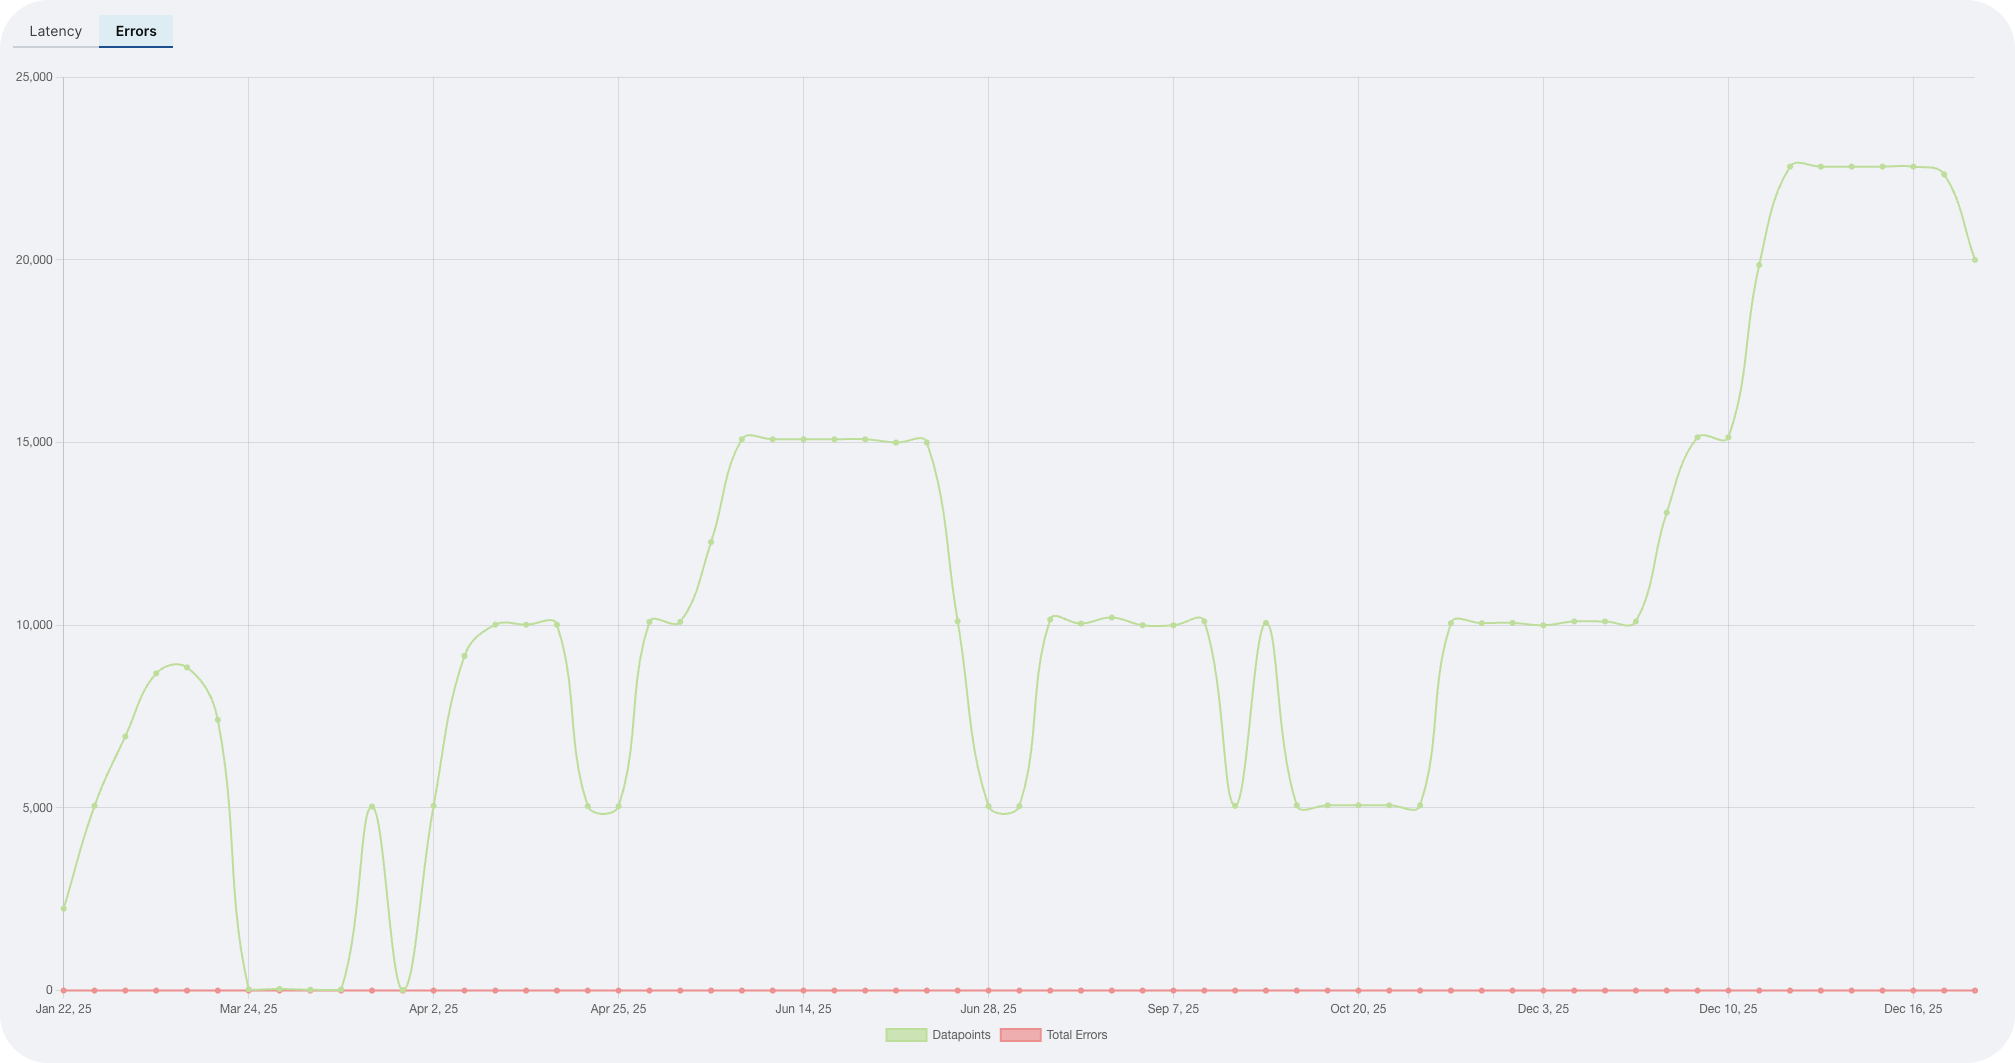
Errors over time chart
A line chart displays two key metrics over time:
- Number of datapoints: The total number of records processed (displayed as one line).
- Number of errors: The total number of errors that occurred (displayed as another line).
This dual-line chart helps you:
- Identify correlations between processing volume and error rates
- Spot error spikes or patterns over time
- Assess the error rate as a percentage of total datapoints
Error details table
The error details table lists error information with the following columns:
- Date: The date when errors occurred.
- Model name: The name of the eScorer model that produced the errors.
- Score mode: The score mode used when the errors occurred.
- Total number of errors: The count of errors that occurred on that date.
- Last error message: The most recent error message recorded for that combination of date, model, and score mode.
Use this table to:
- Identify recurring error patterns
- Review specific error messages for troubleshooting
- Track which models or score modes are most prone to errors

If you notice a high error rate or recurring error messages, review your model configuration and input data quality. Contact support if the errors persist.
Use time period filtering to focus on recent activity or investigate historical trends.
- Submit and view feedback for this page
- Send feedback about H2O Admin Center to cloud-feedback@h2o.ai