h2oGPTe insights
The h2oGPTe insights page provides detailed usage statistics and event tracking for h2oGPTe in your H2O AI Managed Cloud (HAMC) environment. The page includes two tabs, Summary and Events that help you monitor token usage, API activity, and user events.
Click h2oGPTe under Analytics on the left-navigation bar to open the h2oGPTe insights page.
Telemetry data on this page is updated twice daily.
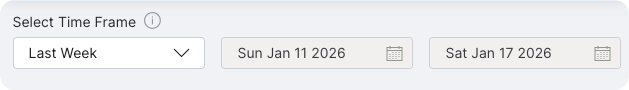
Time period filtering
You can filter data by selecting a time period using the Select Time Frame selector. The selected time period applies to both the Summary and Events tabs, allowing you to analyze usage patterns within your specified date range.
Summary
The Summary tab displays a comprehensive overview of h2oGPTe usage during the selected time period. This tab includes statistics on token usage, API activity, and various event types.
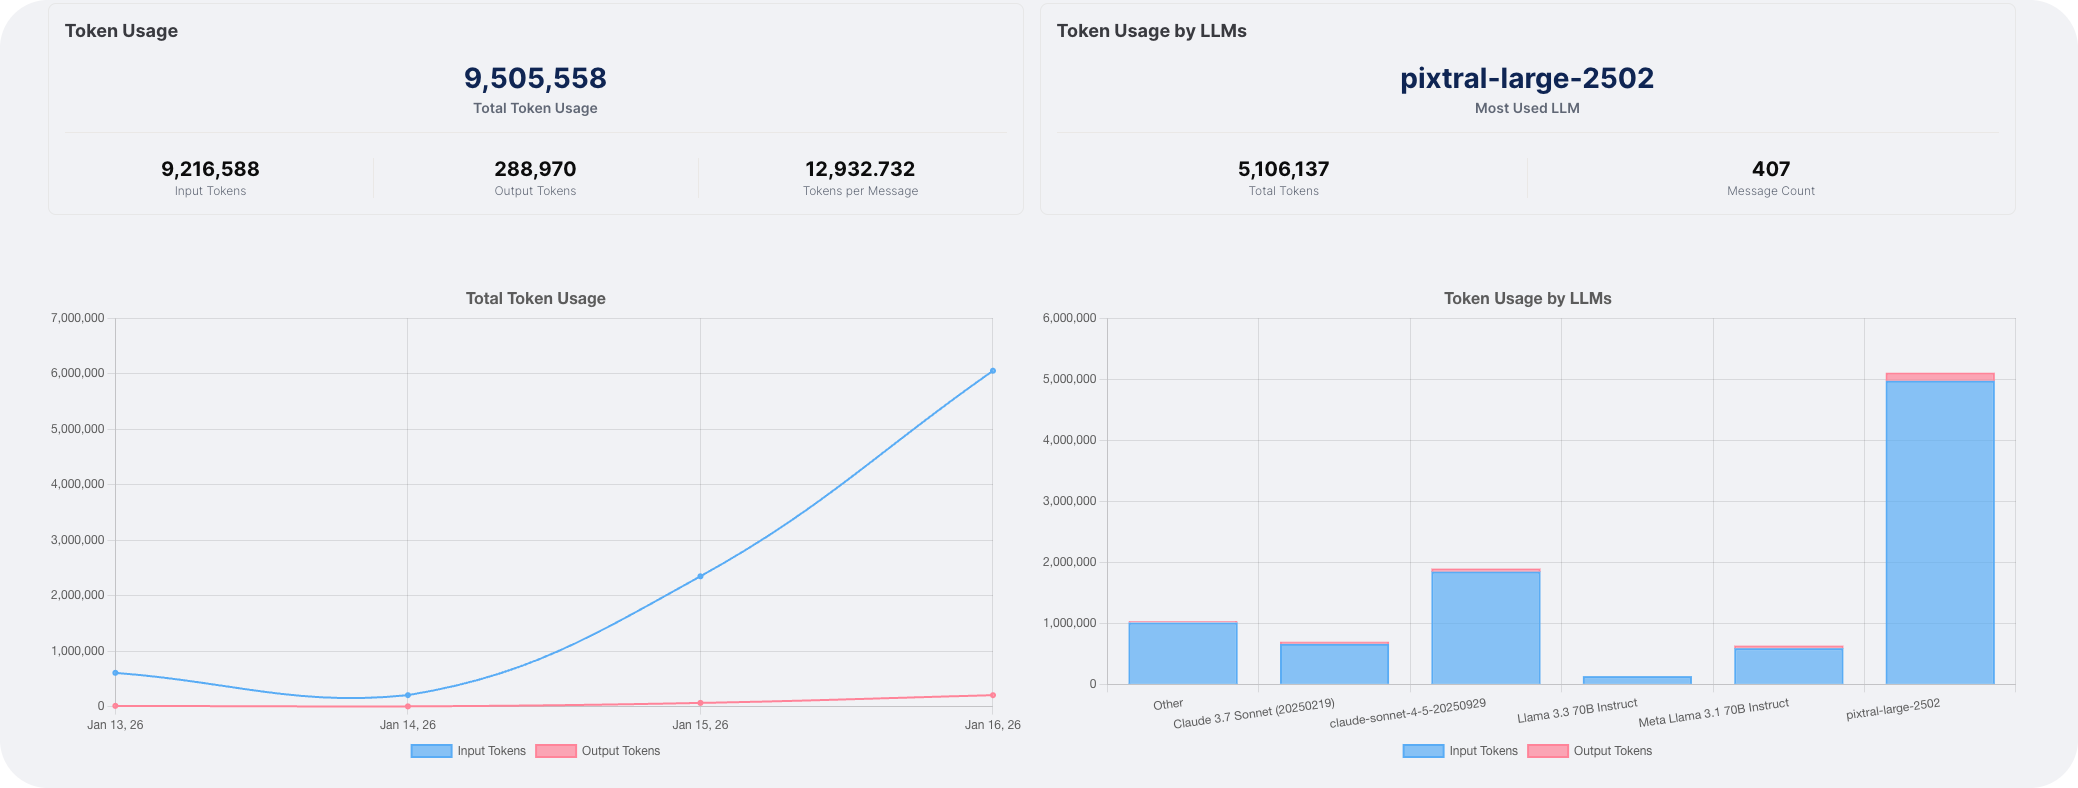
Token usage
The token usage section displays statistics for both input and output tokens:
- Total input and output tokens: The cumulative count of tokens processed during the selected period.
- Usage by LLM: A breakdown of token usage organized by each Large Language Model (LLM) used.
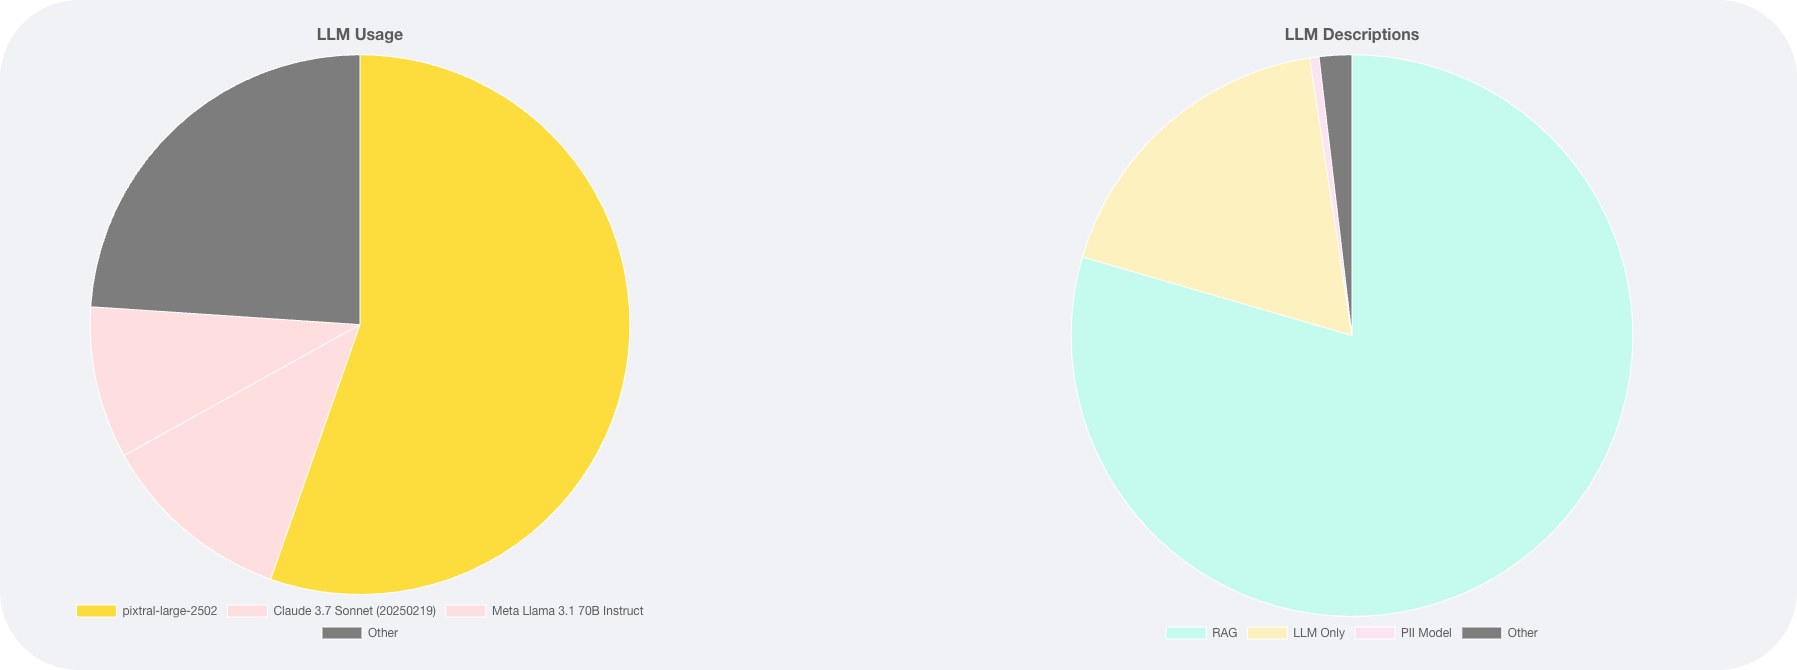
LLM occurrences
This section shows the number of occurrences for each LLM and the descriptions used:
- Pie charts display the LLMs with the highest usage counts.
- The pie charts show only the top components by value. If there are additional LLMs with lower usage, they are grouped into an Other slice.
- Click the Other slice to expand and see the complete list of remaining LLMs and their usage counts.
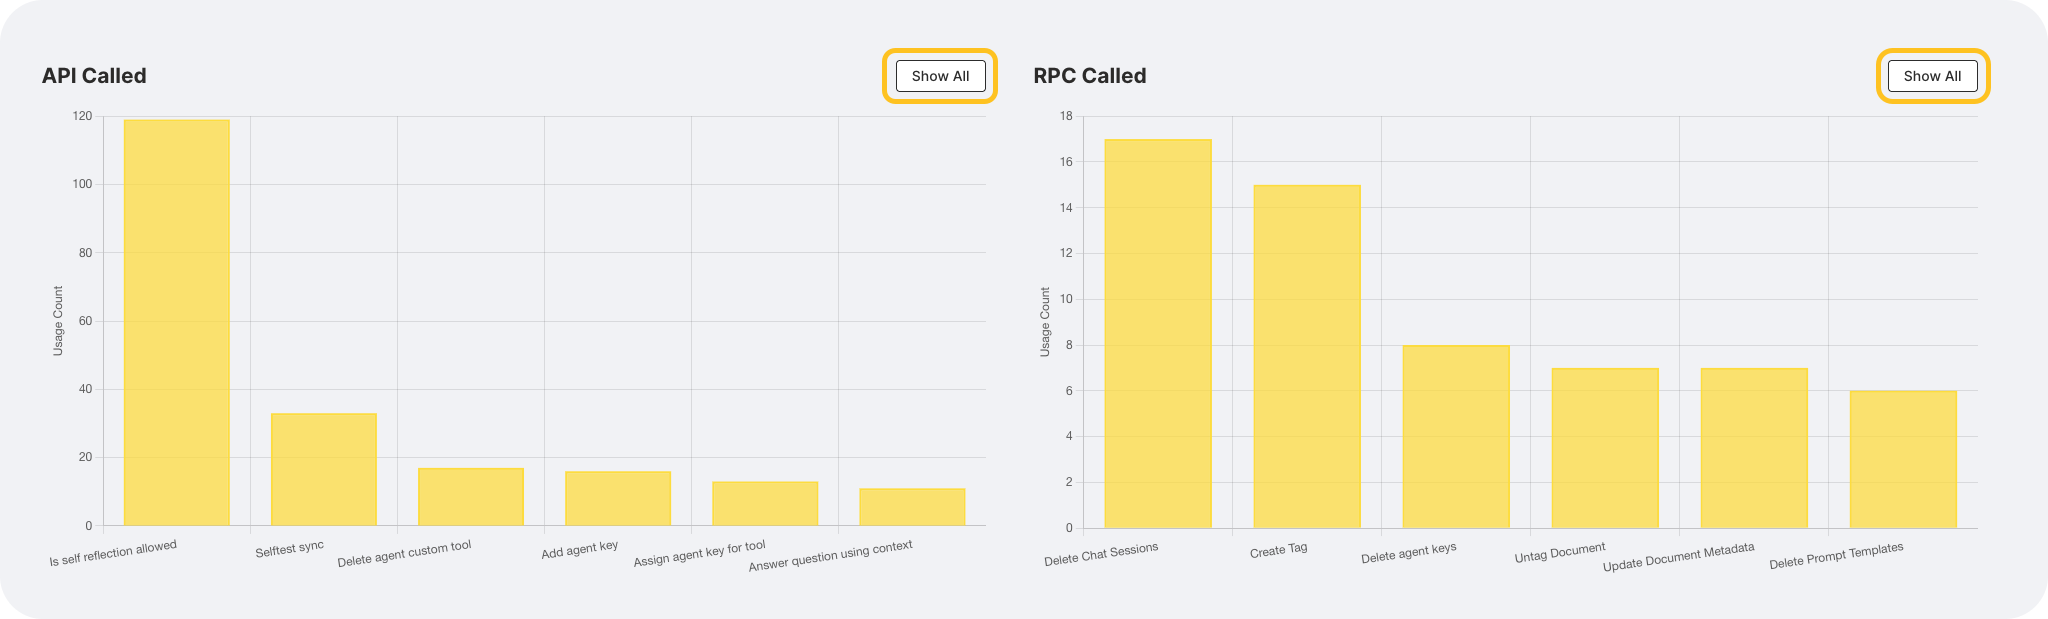
API and RPC events
Bar charts display the number of API and RPC (Remote Procedure Call) event calls:
- API events: The count of API calls made during the selected period.
- RPC events: The count of RPC calls made during the selected period.
The bar charts display only the events with the highest values. To view the complete list of all events, click Show all.
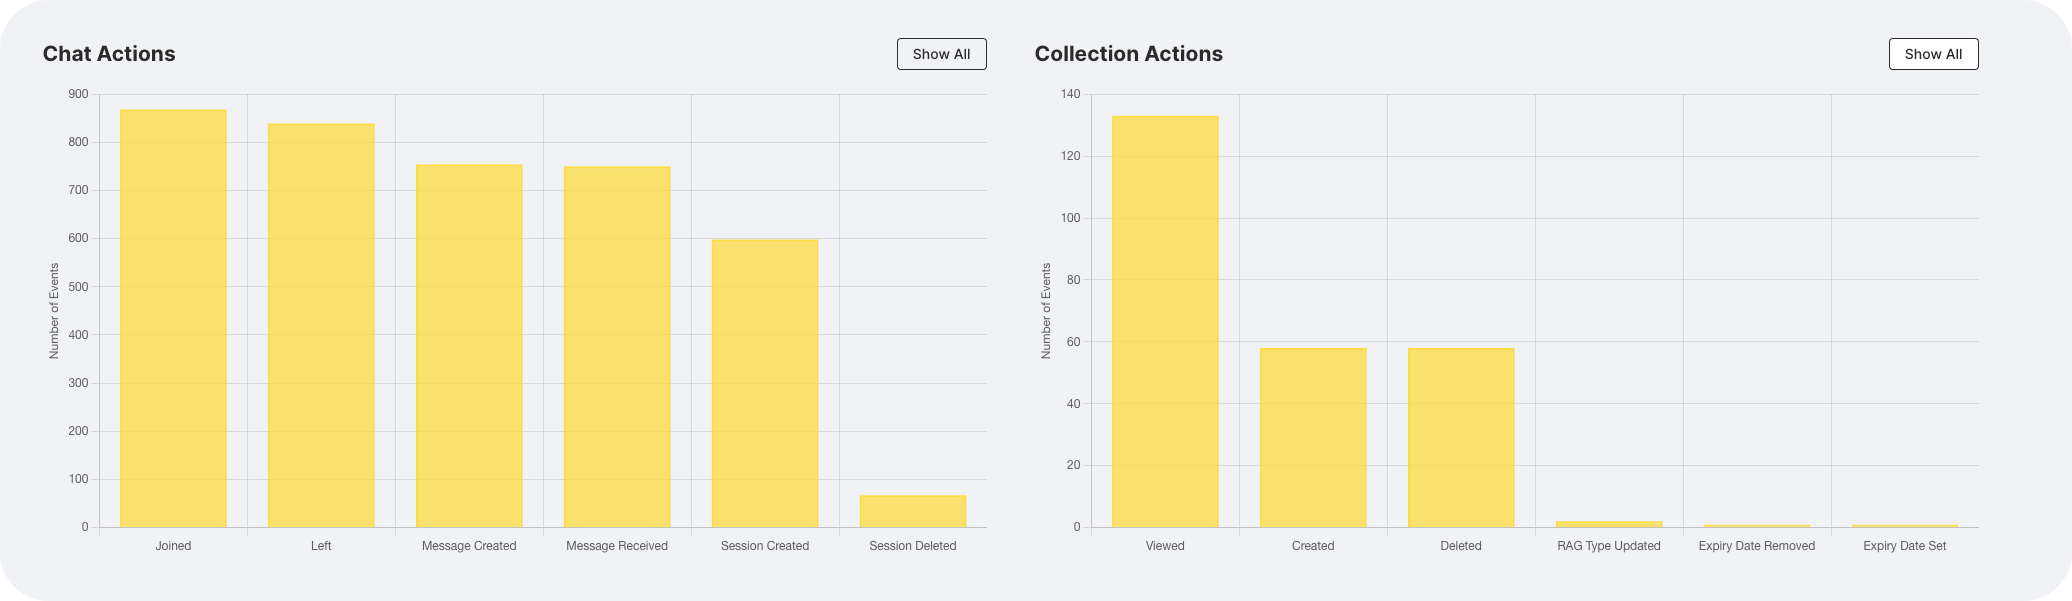
Chat and collection events
This section displays event counts related to chats and collections:
- Chat events: The number of chat-related activities during the selected period.
- Collection events: The number of collection-related activities during the selected period.
Similar to API and RPC events, the bar charts show the highest values. Click Show all to see the complete list.
Job events
The job events section displays the count of job-related events that occurred during the selected time period. This includes job submissions, completions, and other job-related activities.
Document events
The document events section displays the count of document-related events, including document uploads, processing, and other document-related activities during the selected period.
Events
The Events tab provides a detailed view of individual events over time. This tab includes both a visual representation and a detailed table of event data.
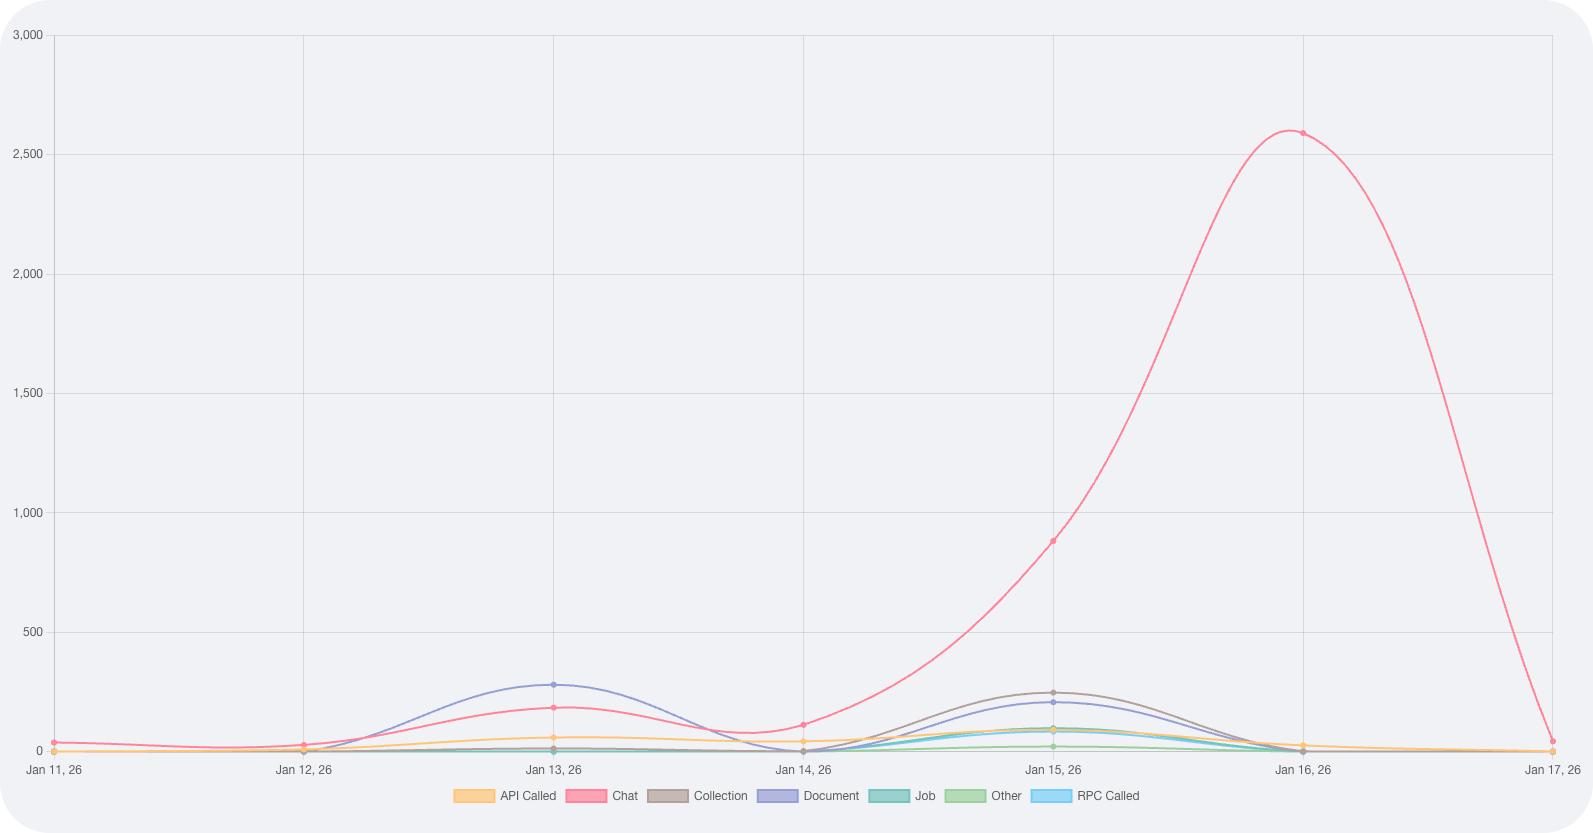
Event timeline
A line chart displays the count of different event types over the selected time period. Each event type is represented by a separate line, making it easy to identify trends and patterns in event occurrences.
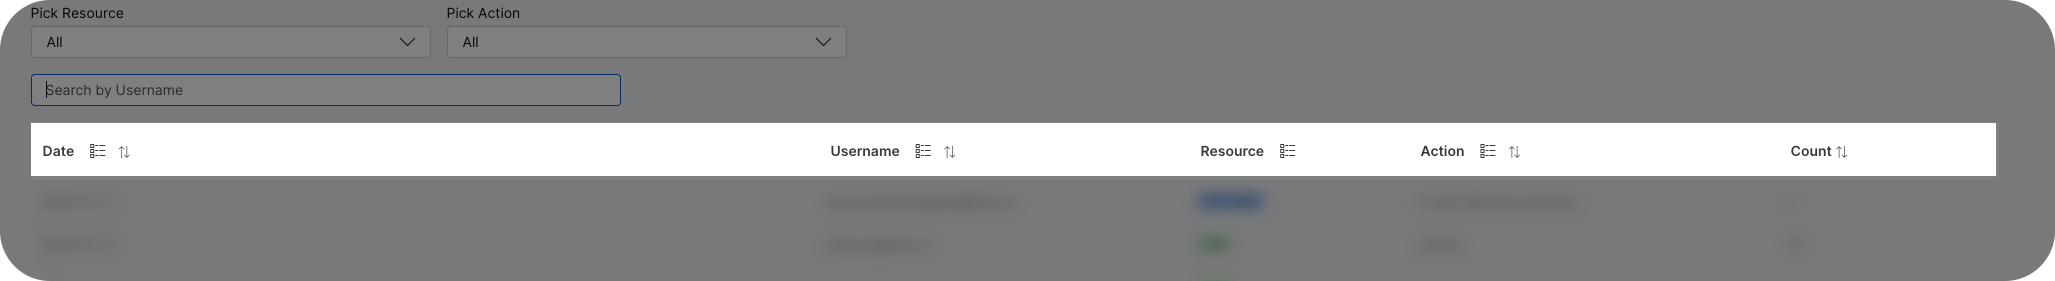
Event details
The event details table lists individual events with the following information:
- Date: The date when the event occurred.
- Username: The Username of the user who triggered the event.
- Resource: The type of event that occurred.
- Action: The action performed.
- Count: The numerical count of how many times the action was performed.
You can scroll through the table to review all events within your selected time period.
- Use the time period filter to focus on specific date ranges and identify usage patterns.
- Export functionality may be available for generating reports from the displayed data.
- Submit and view feedback for this page
- Send feedback about H2O Admin Center to cloud-feedback@h2o.ai