Configure monitoring
This guide explains how to enable and configure model monitoring during deployment using the H2O MLOps UI.
Step 1: Enable model monitoring
To enable model monitoring for your deployment:
- In the left navigation panel, click Real-time deployments.
- Click Create deployment.

- On the Create new deployment page, click Advanced settings.
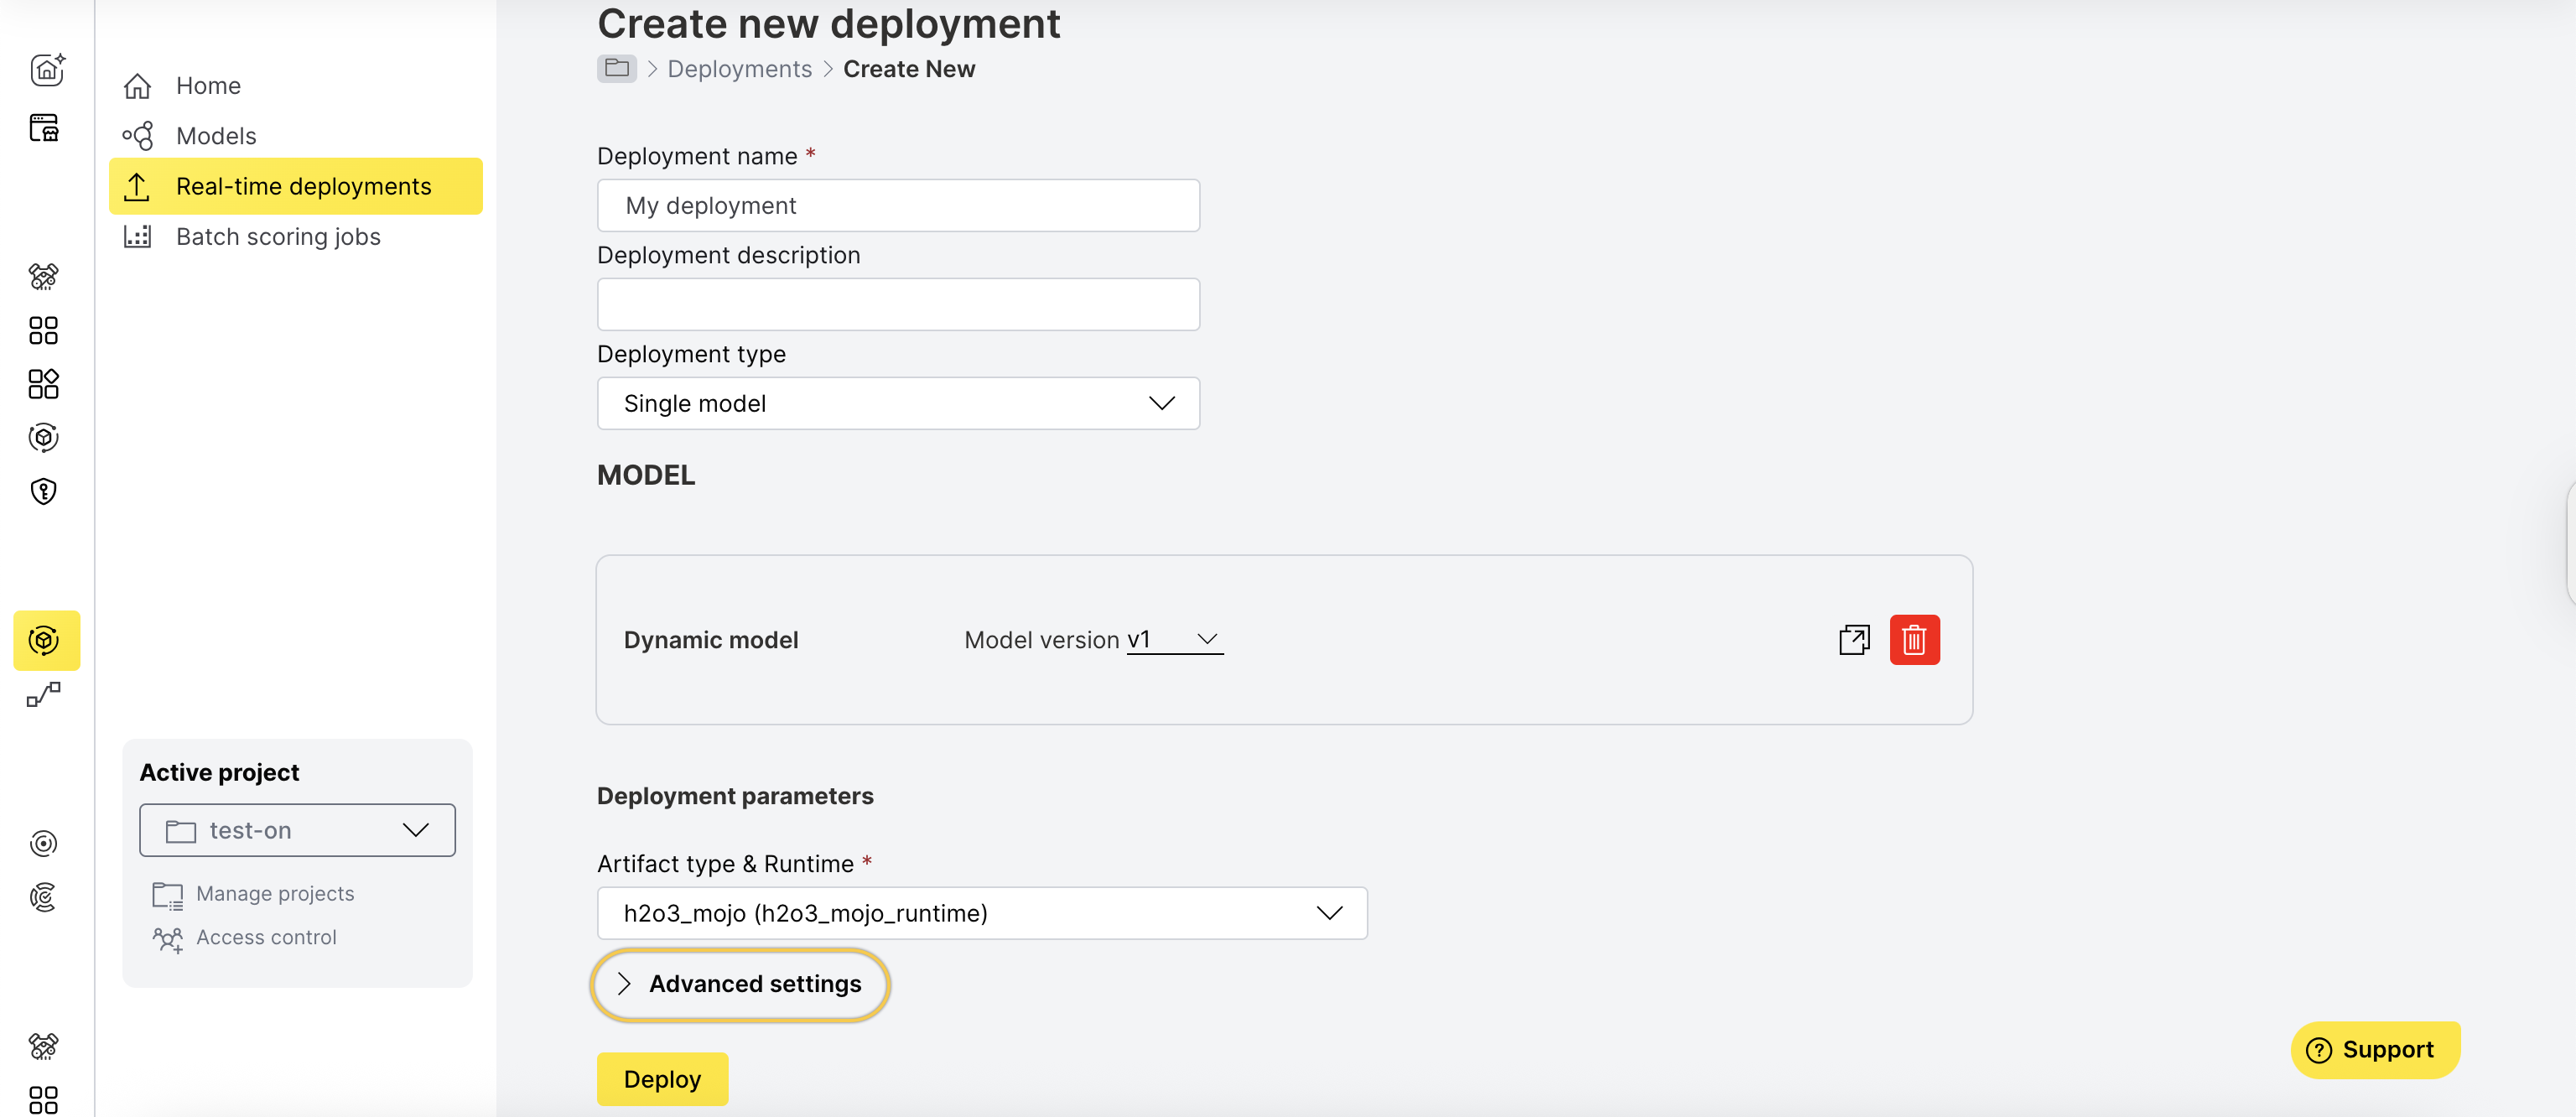
- Toggle Enable monitoring to Yes.

Step 2: Configure and deploy
During model deployment, configure monitoring to collect and analyze data.
- If Kafka is available in your environment, provide a pre-created Kafka topic where raw data will be sent.
For more information, see Raw data export to Kafka.
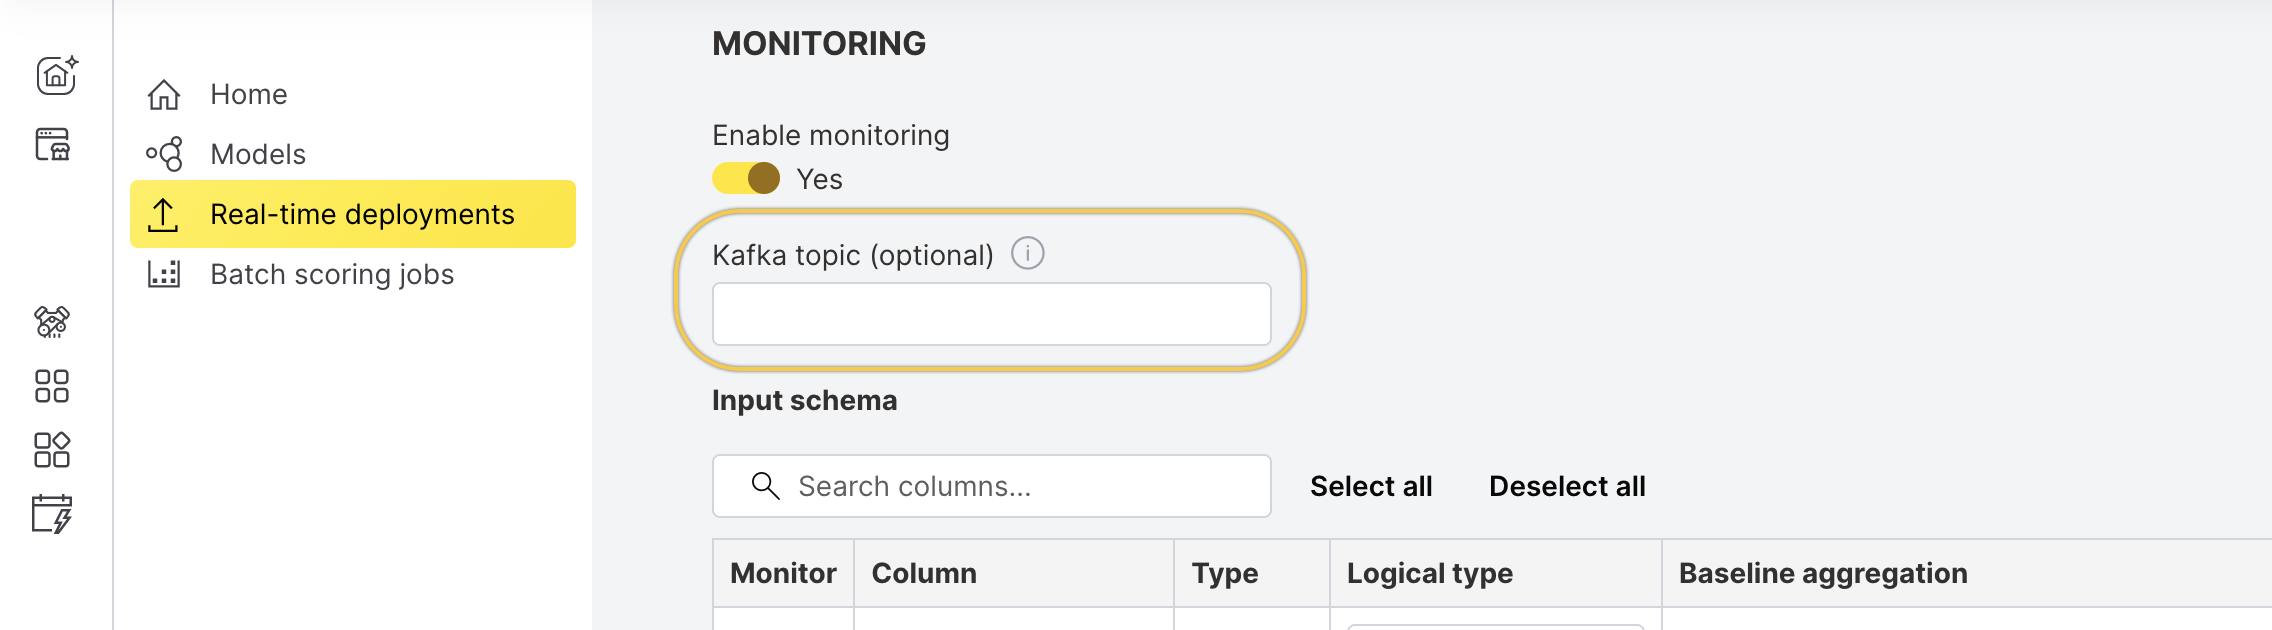
- Select the columns you want to monitor.

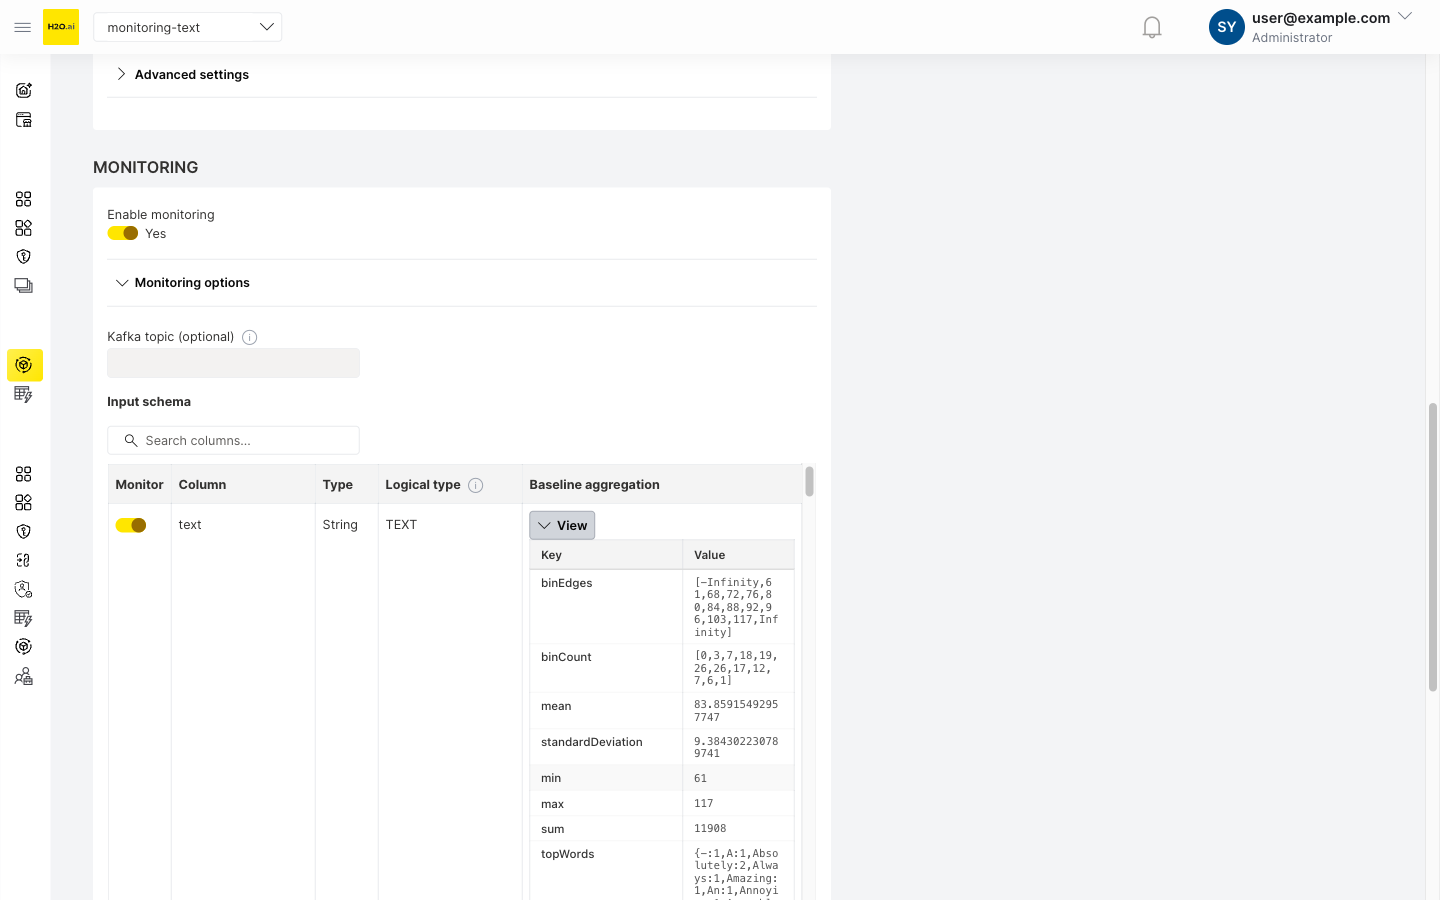
- Provide baseline data for comparison:
- Numerical features:

- Categorical features:

- Text features: Text columns are monitored using character length distributions and vocabulary analysis. For details, see Text column feature monitoring.
- Numerical features:
- Click Deploy.
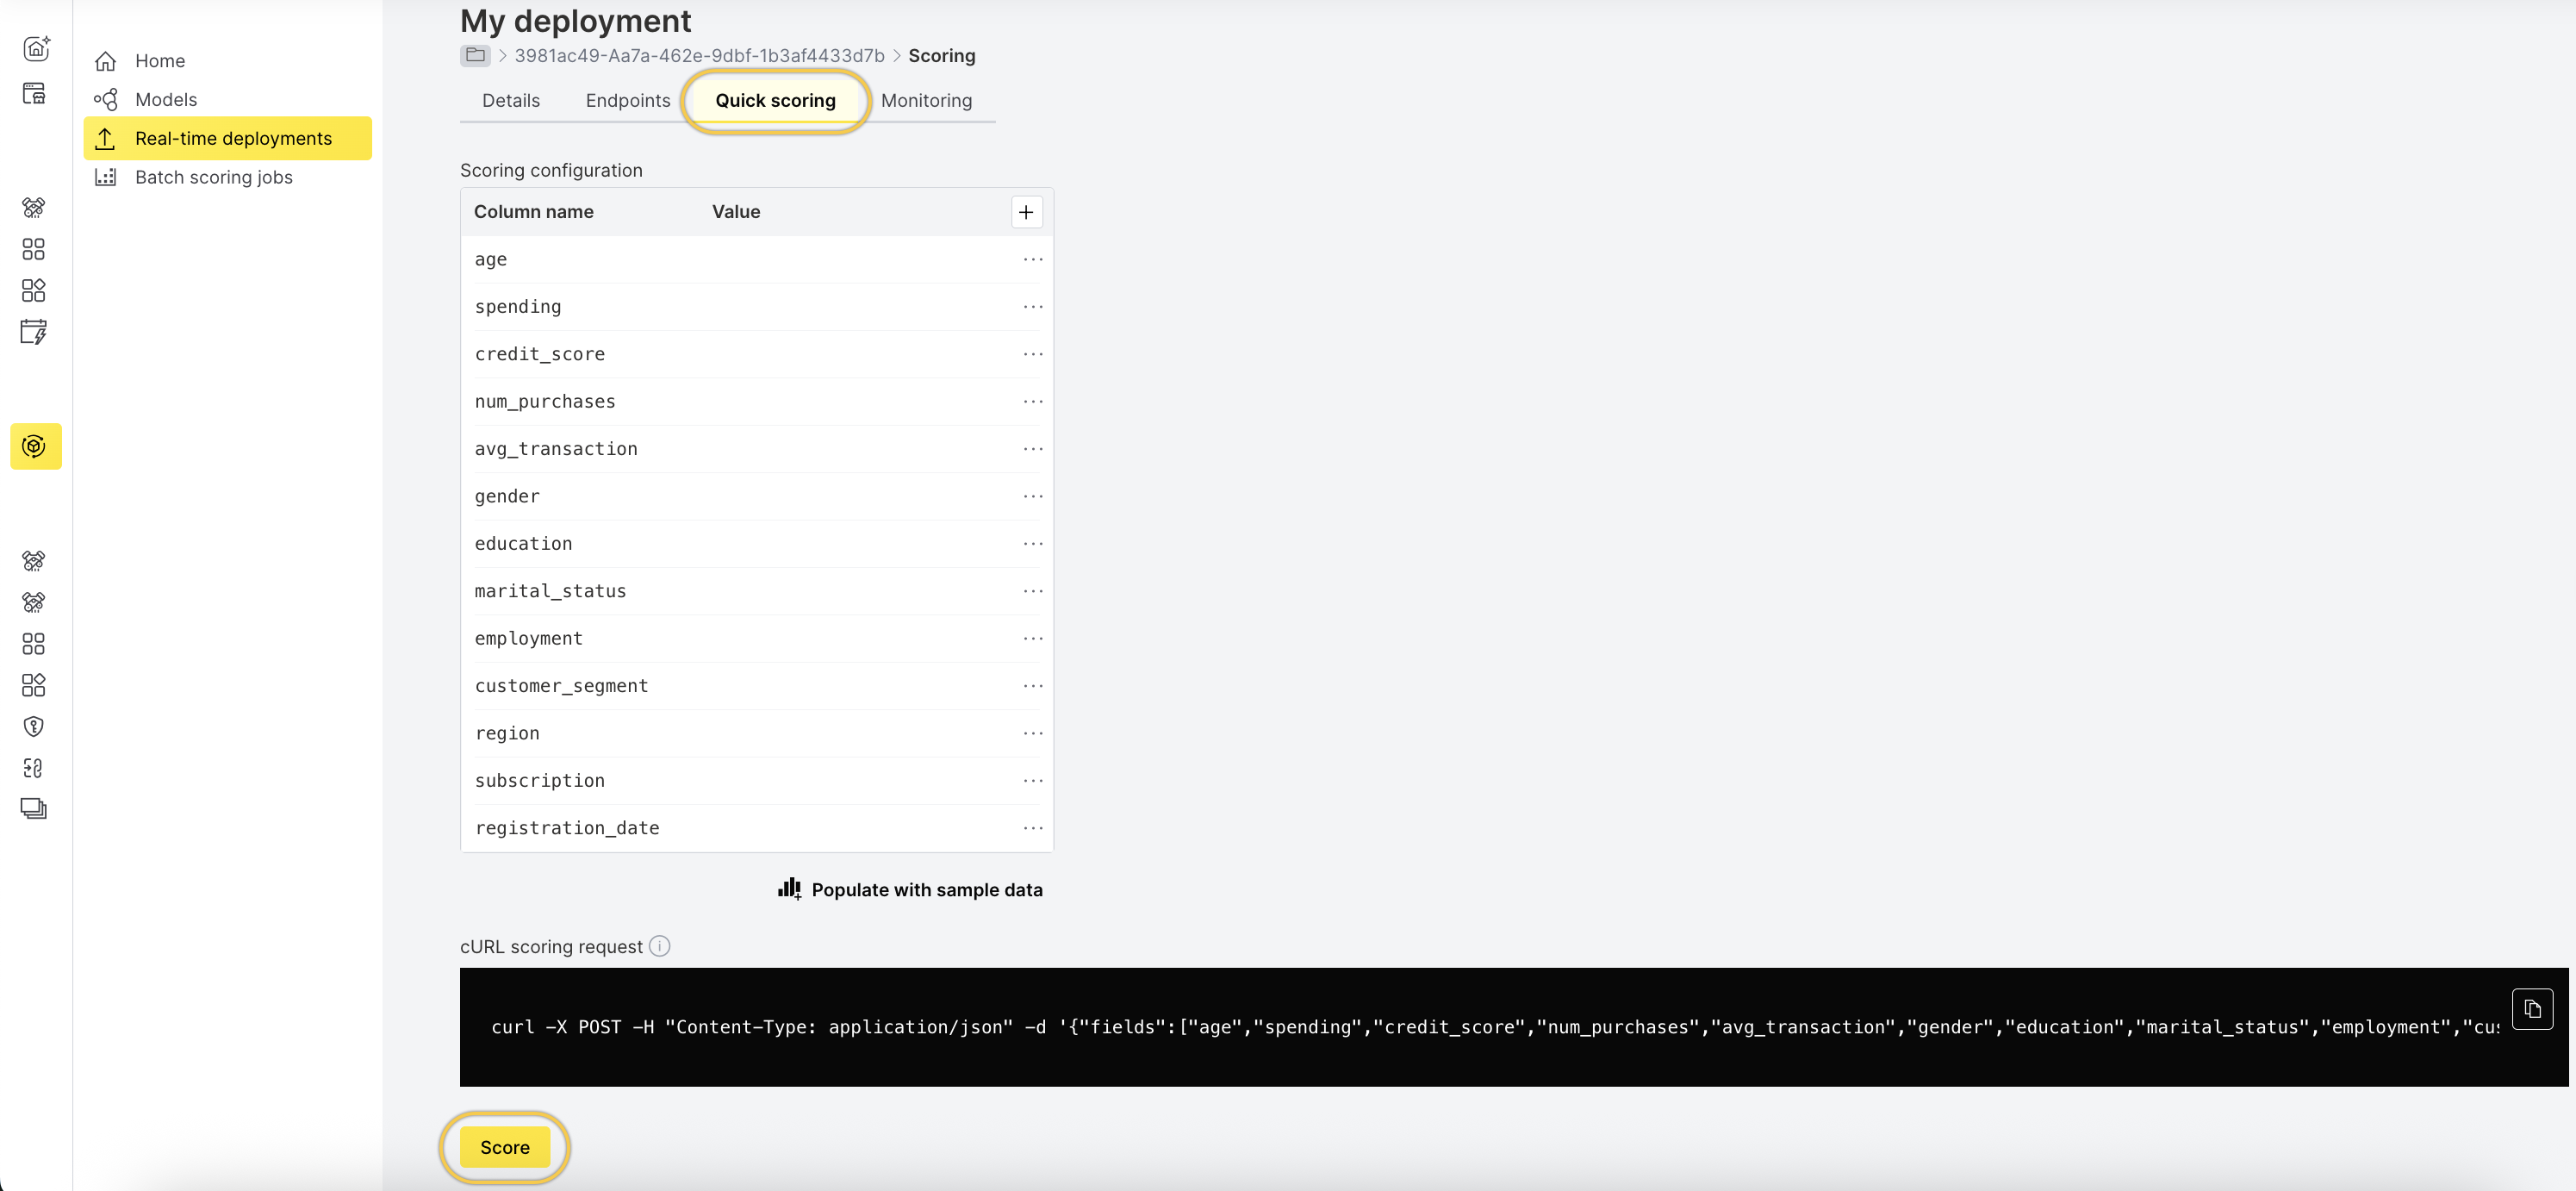
Step 3: Start scoring
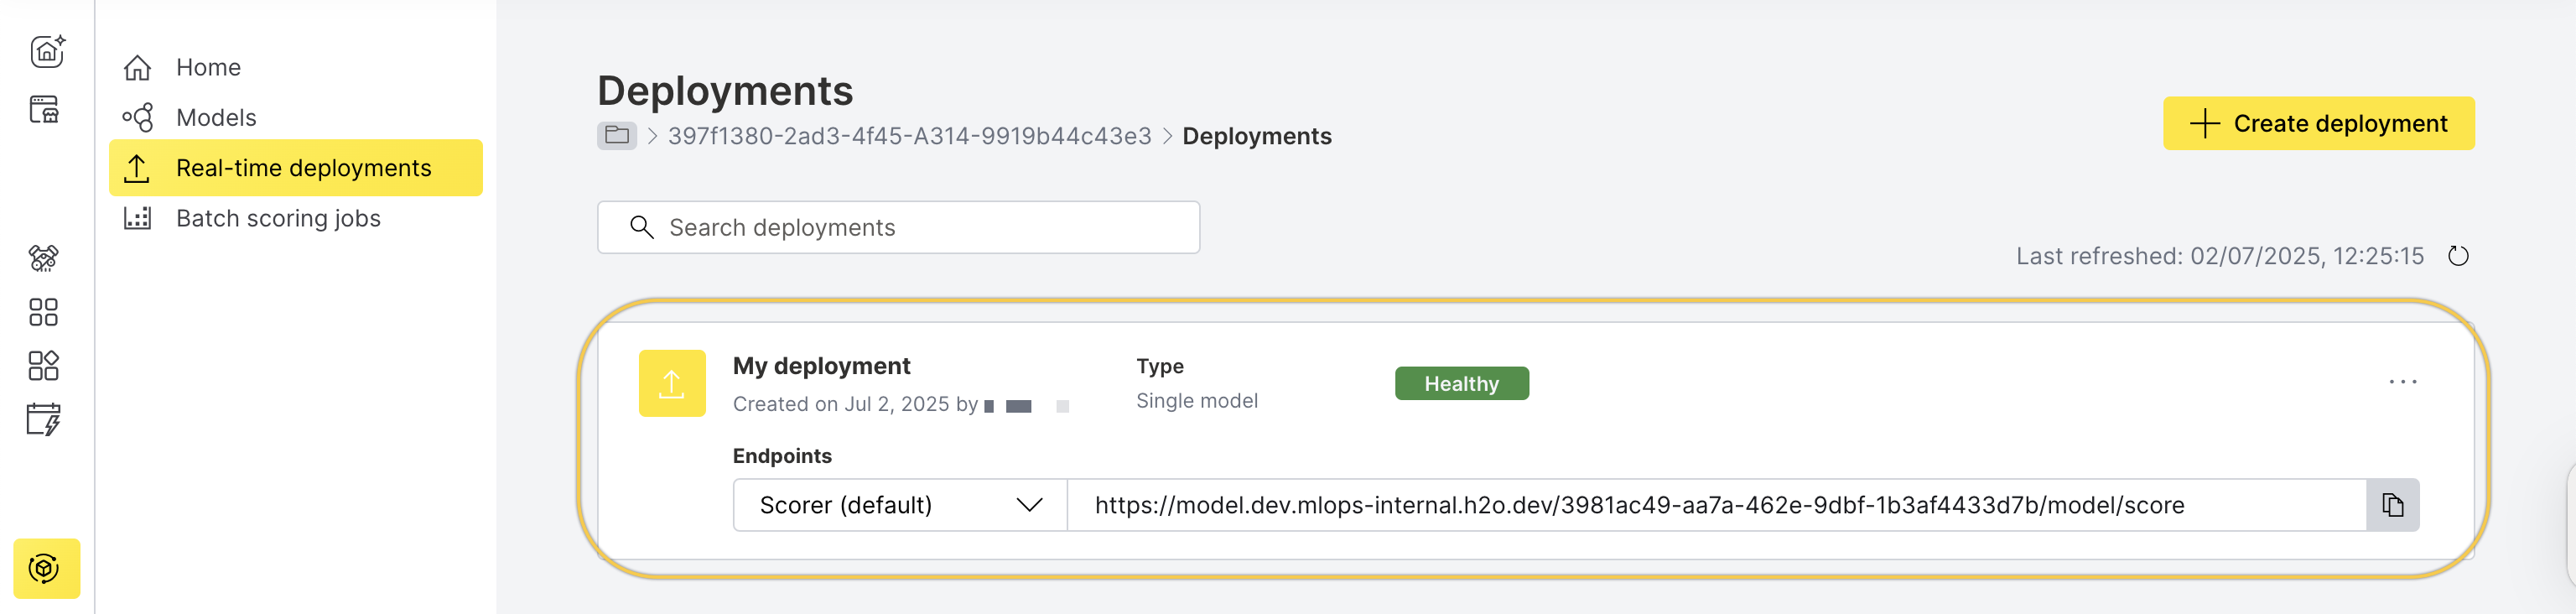
Once the deployment is Healthy, you can begin scoring.
- In the left navigation panel, click Real-time deployments.
- Select the deployment you created.
- Go to the Quick scoring tab.
- Click Score.
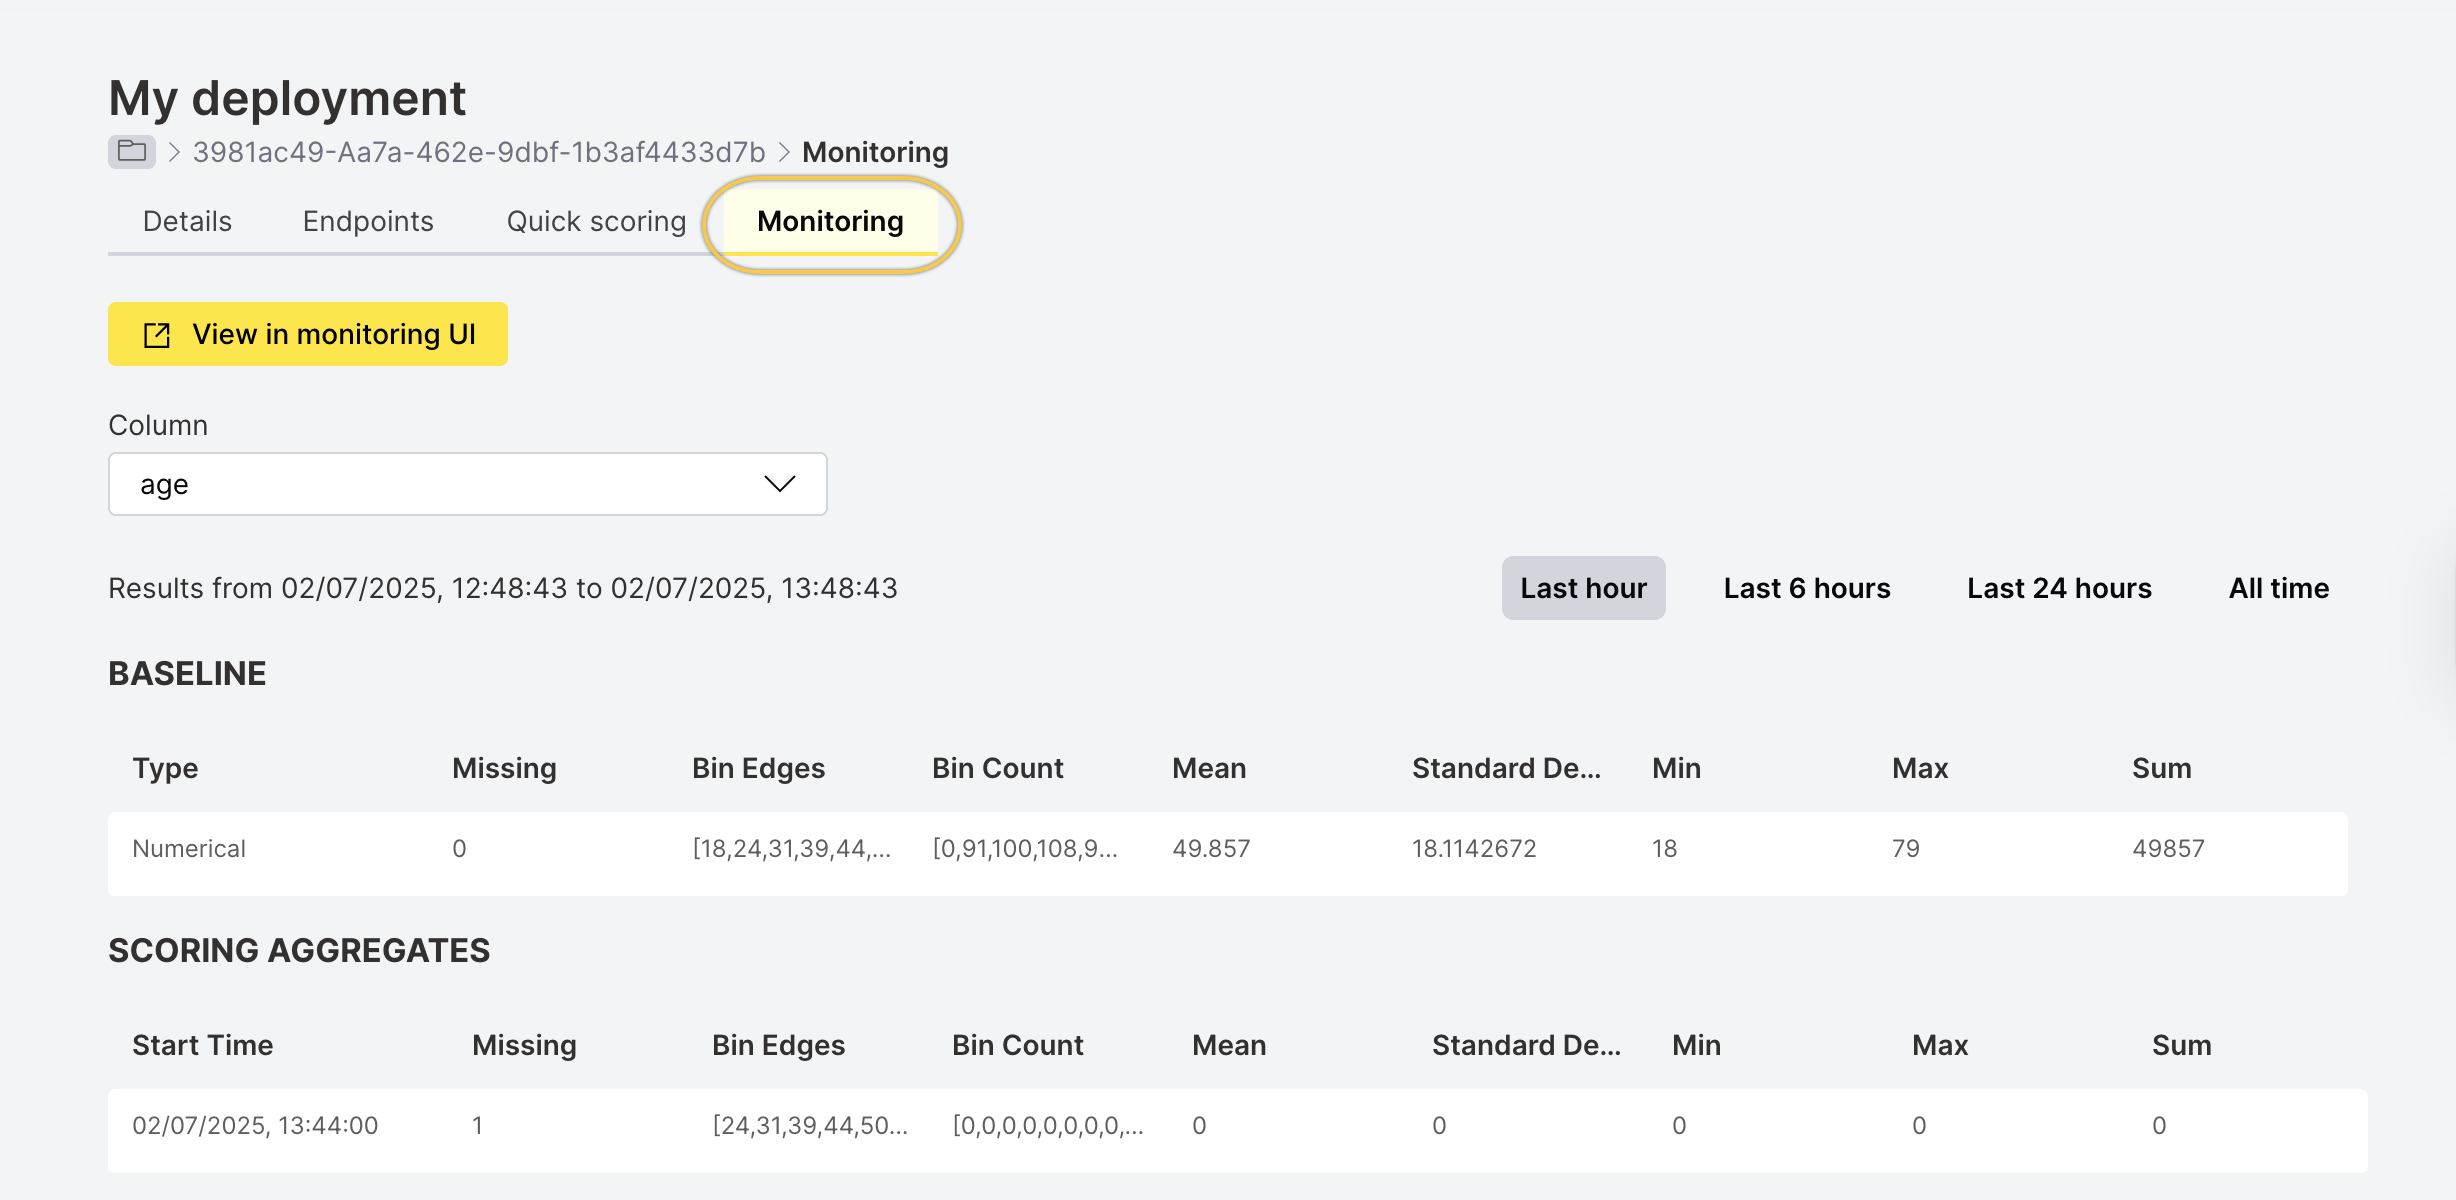
Step 4: View aggregated data
To view the scoring aggregates for each monitored column:
- After scoring completes, go to the Monitoring tab.
- Wait 3–5 minutes to see data under SCORING AGGREGATES.
Step 5: Open the monitoring UI
To view and analyze model drift:
-
Click View in monitoring UI.

-
The Superset UI opens.
-
From the SQL drop-down, select SQL Lab.

-
Schema and table selection:
- Schema name is the Workspace ID from the H2O AI Cloud Workspaces UI. Copy the Workspace ID and select that schema in Superset. See Workspaces in H2O AI Cloud.
- Table name is the Deployment ID. From the MLOps Deployments page, copy the deployment ID (it appears in the default scorer URL). In Superset, select the table named
aggregates_<deployment_id>. - Alternatively, in SQL Lab, use the dropdowns labeled Schema and See table schema to choose the workspace (schema) and
aggregates_<deployment_id>(table).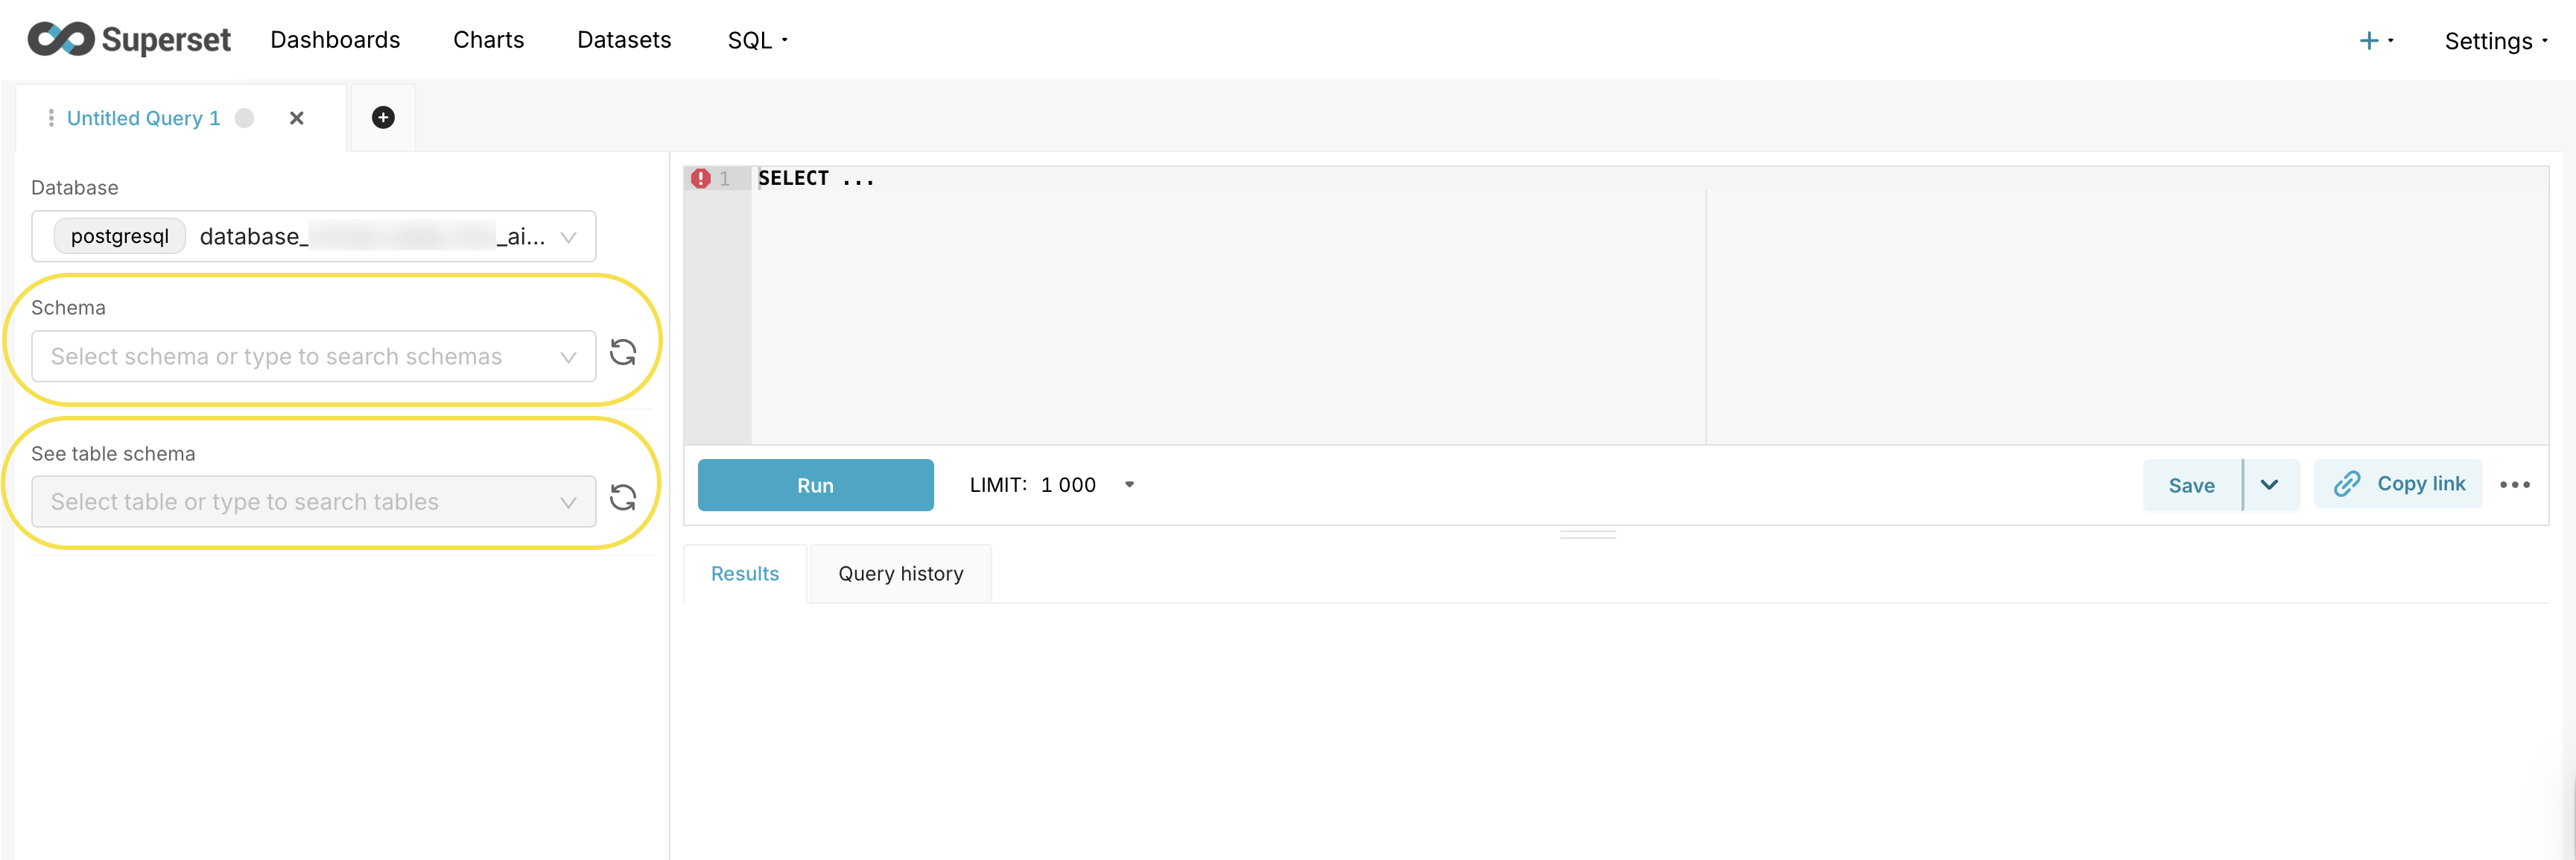
In Superset, you can only see and query schemas for workspaces you have access to. If a schema is not visible in the dropdown, contact your administrator to verify your workspace permissions.
If you attempt to query a schema you do not have access to, you will receive a permission error listing the unauthorized schema names. This means your account has not been granted access to that workspace. Contact your administrator to request workspace access.
After completing these steps, you can proceed to analyze drift in Superset.
Configure monitoring with the Python client
To learn how to configure monitoring for your deployment using the H2O MLOps Python client, see Monitoring setup.
- Submit and view feedback for this page
- Send feedback about H2O MLOps to cloud-feedback@h2o.ai